Official statement
Other statements from this video 15 ▾
- □ Les fluctuations de classement sont-elles vraiment normales ou cachent-elles un problème technique ?
- □ Google utilise-t-il vraiment un seul index mondial pour tous les pays ?
- □ Faut-il encore se fier aux résultats de la requête site: pour diagnostiquer l'indexation ?
- □ L'engagement utilisateur influence-t-il réellement le classement Google ?
- □ Pourquoi les pages à fort trafic pèsent-elles plus dans le score Core Web Vitals ?
- □ Google segmente-t-il vraiment les sites par type de template pour évaluer la Page Experience ?
- □ Combien de liens internes faut-il placer par page pour optimiser son SEO ?
- □ Pourquoi la structure en arbre de votre maillage interne compte-t-elle vraiment pour Google ?
- □ La distance depuis la homepage influence-t-elle vraiment la vitesse d'indexation ?
- □ Pourquoi la structure d'URL n'a-t-elle aucune importance pour Google ?
- □ Google distingue-t-il vraiment 'edit video' et 'video editor' comme des intentions différentes ?
- □ Le balisage FAQ doit-il obligatoirement figurer sur la page indexée pour générer un rich snippet ?
- □ Les liens en footer ont-ils la même valeur SEO que les liens dans le contenu ?
- □ L'indexation mobile-first a-t-elle un impact sur vos classements Google ?
- □ Faut-il vraiment qu'un robots.txt inexistant retourne un 404 pour éviter de bloquer Googlebot ?
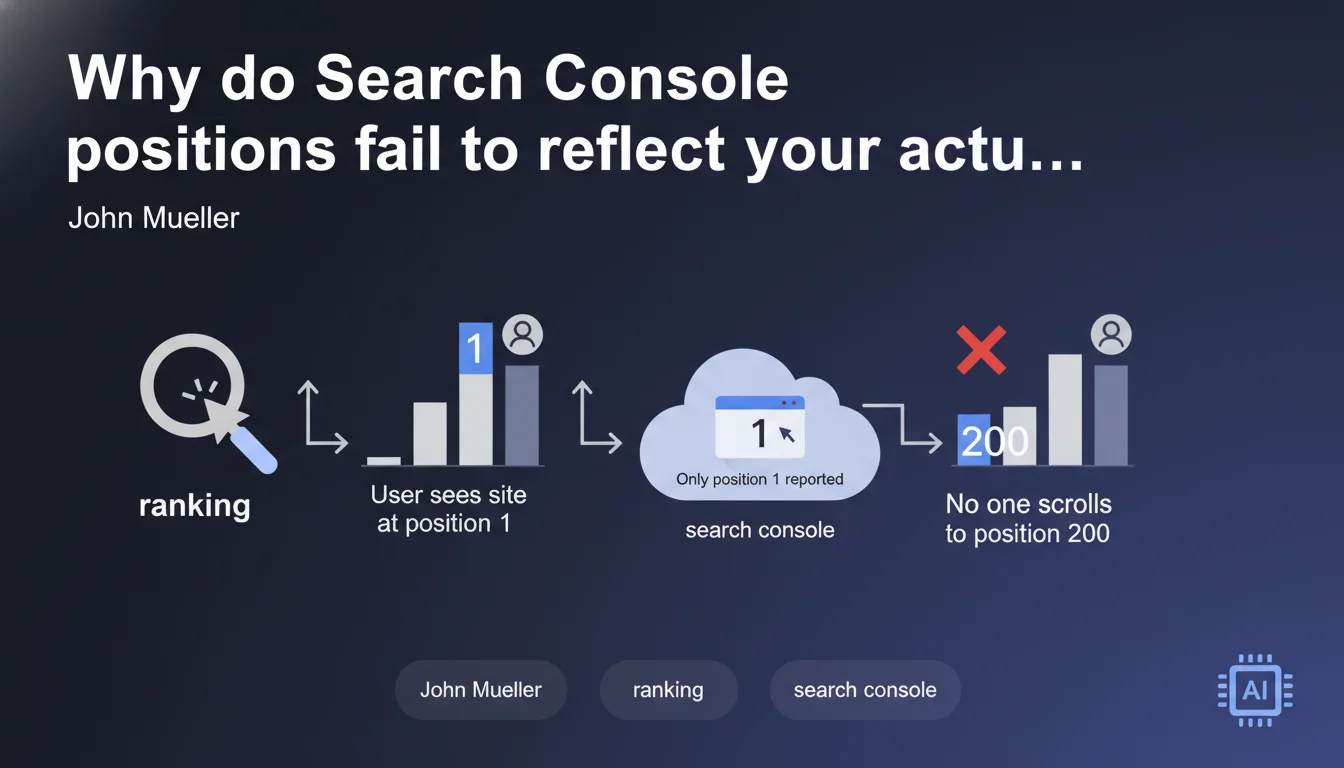
The positions displayed in Search Console correspond only to real impressions, not theoretical ranking. If your site appears in position 1 for a few users and position 200 for others who never scroll that far, only position 1 will be counted. This metric is therefore biased by user behavior and does not represent your complete SERP positioning.
What you need to understand
What does "based on real impressions" actually mean?
Search Console doesn't show you where your site could theoretically appear in search results. It displays only the positions where real users have actually seen your URL display on their screens.
If your site is ranked at position 150 but nobody scrolls to page 15, this position will never exist in your GSC data. Only positions that generated at least one impression are counted.
Why can this metric be misleading?
Imagine a concrete scenario. Your article appears in position 3 for a high-volume query, but also in position 87 for a long-tail variant. If this second position generates zero impressions (nobody goes to page 9), your average position reported in GSC will be artificially inflated.
The problem is that you lose all visibility into positions where you are invisible in practice. You might believe you're dominating a topic when in reality, you're buried for 80% of query variations.
How does Google calculate this average position?
The average position displayed in GSC is a weighted average by impressions. Concretely: if you get 100 impressions in position 1 and 10 impressions in position 50, your average position will be approximately 5.8 — not 25.5 as in a standard arithmetic average.
This weighting massively favors top positions that naturally generate more impressions. Result: your average positions always seem better than they actually are across your full query spectrum.
- Positions without impressions never appear in GSC
- Average position is weighted by the number of impressions at each rank
- Top positions mathematically dominate the calculation because they generate more views
- This metric does not reveal your theoretical positioning across all query variations
- A site can display an average position of 3 while being invisible on 70% of your target keywords
SEO Expert opinion
Is this statement consistent with real-world observations?
Absolutely, and it's actually a trap many advertisers fall into. I've seen clients celebrating an average position of 4.2 on a semantic cluster, while a SEMrush analysis revealed they were absent from the top 50 for 60% of their strategic keywords.
The bias is real and measurable. Third-party tools that track positions systematically (independently of impressions) often paint a much darker picture than GSC. It's not that GSC lies — it simply measures a different reality: that of actual visibility, not exhaustive ranking.
What are the concrete limitations of this metric?
First problem: the tunnel effect. You optimize to improve an average position that only reflects your visible positions. Catastrophic positions remain invisible in your KPIs. You can stagnate for months without realizing your problem lies elsewhere.
Second problem: behavioral seasonality. During high-search periods, users scroll more. Your average positions can mechanically decline not because you've lost rankings, but because low positions suddenly become visible. [To verify] with longitudinal data, but the hypothesis holds up.
Third limitation: SERPs evolve. With featured snippets, People Also Ask, local cards, "position 1" is no longer what it was five years ago. A position 3 might mean your organic link appears after 1200 pixels of scroll — but GSC will just tell you "position 3".
In what cases does this metric remain reliable?
It makes sense for high-volume queries where scroll-through rate is statistically stable. For a query with 50,000 monthly searches, even if only 2% of users go to page 3, that's 1,000 impressions — enough to detect a real position.
It's also relevant for comparing temporal variations on the same site. If your average position moves from 8.2 to 5.4 over three months, there's been real improvement — even if the metric remains biased in absolute terms. It's the dynamics that matter, not the raw figure.
Practical impact and recommendations
What should you concretely do to interpret GSC correctly?
Stop looking at the global average position. Drill down to the individual query level. Filter by impression volume. Identify high-potential queries (volume + intent) where you're invisible (zero impressions or position >20).
Use the "Pages" dimension to identify URLs generating impressions but low clicks. A page with 1,000 impressions and 0.8% CTR at average position 6 has a title/meta description problem — not necessarily a positioning problem.
What errors should you avoid when analyzing positions?
Never compare your GSC average position with a competitor's tracked via a third-party tool. You're not measuring the same thing. GSC = positions with impressions. SEMrush = theoretical scraped positions. The gap can reach 5 to 10 ranks on certain clusters.
Also avoid segmenting by device (mobile/desktop) without cross-referencing with impressions. An average mobile position of 12 might seem catastrophic, but if it generates 80% of your total impressions, it's because mobile users scroll more on this query. Context changes interpretation.
How do you build a reliable SEO dashboard?
Integrate three sources: GSC for visible positions, a tracker for exhaustive positions, and a crawl tool to detect technical issues breaking indexation. No single tool gives the complete truth.
Set up alerts for sudden impression drops — not just position changes. A page moving from 5,000 to 200 impressions without average position change has likely been partially deindexed or hit by cannibalization.
- Analyze positions at query level, not global average
- Cross-reference GSC with an exhaustive tracking tool (Ranks, SEMrush, Ahrefs)
- Segment by search intent, not just volume
- Identify strategic queries where you generate zero impressions
- Track impression variations, not just position changes
- Configure alerts for impression drops >50% in 7 days
- Verify CTR by position to detect snippet issues
❓ Frequently Asked Questions
Si mon site est en position 50 mais que personne ne voit cette position, elle n'apparaîtra jamais dans GSC ?
Pourquoi ma position moyenne GSC est meilleure que celle affichée par SEMrush ?
La position moyenne peut-elle baisser si Google n'a pas changé mon classement ?
Dois-je arrêter d'utiliser la position moyenne comme KPI ?
Comment expliquer une position moyenne de 3 avec un taux de clics de 1% ?
🎥 From the same video 15
Other SEO insights extracted from this same Google Search Central video · published on 14/03/2022
🎥 Watch the full video on YouTube →
💬 Comments (0)
Be the first to comment.