Official statement
Other statements from this video 10 ▾
- □ Les chaînes de redirections bloquent-elles vraiment le crawl de Google sur votre site ?
- □ Pourquoi l'écart entre URLs découvertes et indexées révèle-t-il des problèmes critiques ?
- □ Pourquoi les problèmes d'indexation se concentrent-ils sur certains dossiers de votre site ?
- □ Le no-index libère-t-il vraiment du crawl budget pour les pages importantes ?
- □ Les chaînes de redirections tuent-elles vraiment l'expérience utilisateur ?
- □ Faut-il vraiment supprimer toutes les redirections internes de votre site ?
- □ Pourquoi Google ralentit-il son crawl quand votre serveur faiblit ?
- □ L'instabilité serveur peut-elle vraiment déclasser votre site dans Google ?
- □ Faut-il vraiment multiplier les outils de crawl pour diagnostiquer efficacement vos problèmes SEO ?
- □ Pourquoi faut-il détecter les erreurs techniques avant que Google ne les trouve ?
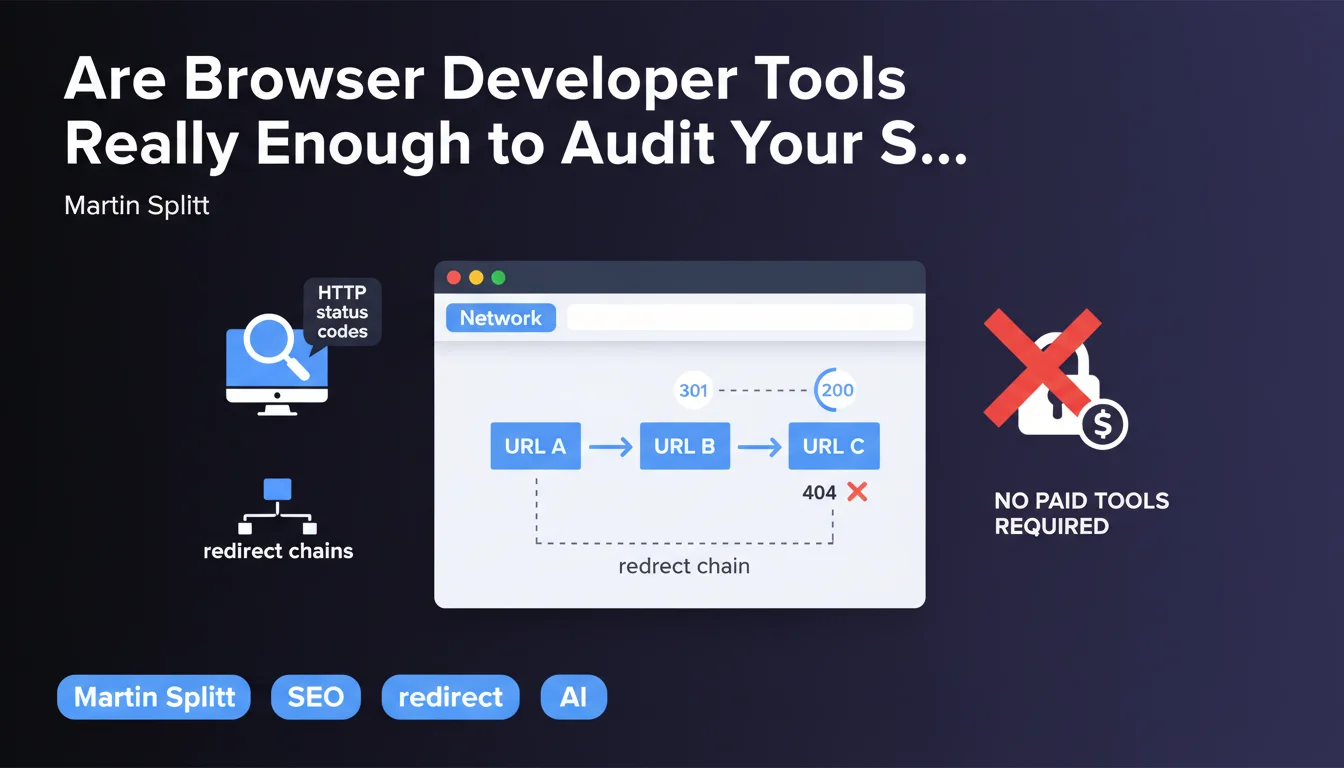
Martin Splitt reminds us that the Network tab in Developer Tools built into Chrome, Firefox, or Safari displays all HTTP status codes (301, 302, 404, 200…) and allows you to identify redirect chains without relying on paid tools. A simple but useful reminder for quickly diagnosing a redirect problem, even if the method remains manual and not very scalable for a complete audit.
What you need to understand
Why Does Google Insist on Developer Tools?
Google seeks to democratize access to technical diagnostics. Martin Splitt emphasizes that modern browsers already come equipped with everything you need to check HTTP status codes and spot redirect chains — without Screaming Frog licenses or Ahrefs subscriptions.
The Network tab in DevTools displays every HTTP request: URL called, method, status, timing, headers. When a 301 or 302 occurs, you see the initial redirect and then the final destination. If three redirects chain together, all three lines appear in the cascade.
Concretely, What Do You See in the Network Tab?
You open DevTools (F12 or Cmd+Option+I), load a page, and every resource called registers in the list. The Status column displays 200, 301, 404, 503… The Type column indicates document, script, stylesheet, image.
To spot a redirect chain: click on the main HTML document line, open the Headers tab, and read Location: in the 3xx responses. If multiple lines bear the same name but with different statuses, you have a chain. Each jump costs time — visible in the Time column.
What Are the Limitations of This Approach?
DevTools show what happens for one URL, not for a site with 10,000 pages. Impossible to export a consolidated report, cross-reference with Googlebot's crawl, or automatically detect all loops.
Moreover, some redirects depend on User-Agent or geolocation: if Googlebot receives different treatment than your browser, you won't see it in DevTools without simulating that agent. Finally, JavaScript redirects or meta-refresh don't always appear clearly in the Network tab — you must cross-reference with the Elements or Console tab.
- The Network tab displays all HTTP codes and allows you to follow redirect chains URL by URL.
- Each request shows the status, headers, timing, and final destination.
- It's free, built into all modern browsers (Chrome, Firefox, Safari, Edge), and requires no installation.
- Conversely, the approach remains manual: impossible to crawl an entire site or detect User-Agent treatment differences without additional tools.
- JavaScript redirects (window.location) or meta-refresh don't always pass through a 3xx status — they sometimes escape the Network tab.
SEO Expert opinion
Is This Recommendation Really Sufficient for a Serious SEO Audit?
Let's be honest: yes, DevTools are valuable for quickly diagnosing a single URL — a client reports a page in 404, you check in three seconds. But no, they don't replace a crawler for identifying all a site's redirects, measuring their impact on crawl budget, or detecting hidden loops.
Google pushes this approach because it reduces reliance on third-party tools and reminds beginners that a browser is enough to grasp the basics. It's educational, not exhaustive. A confirmed SEO expert will always use Screaming Frog, OnCrawl, or Botify to cross-reference data and spot patterns at scale.
In What Cases Do DevTools Show Their Limits?
As soon as you work on a large site with thousands of URLs, the manual method becomes impractical. Multiple redirect chains (A → B → C → D) often exist without being noticed — a crawler detects them in three minutes, DevTools would require hours of manual browsing.
Another trap: conditional redirects (based on User-Agent, language, IP). If Googlebot receives a 301 but your browser sees a 200, DevTools reveal nothing. You must then simulate the correct User-Agent in DevTools (Network conditions tab) or use a tool like curl on the command line. [To verify]: we don't always know how Google handles complex JS redirects — rendering may differ between Chrome headless and official Googlebot.
window.location.href or history.pushState) don't generate HTTP 3xx statuses. They appear as 200 requests in the Network tab, then the DOM changes. To spot them, you must cross-reference with the Console tab or observe the Initiator in the Network. Google may or may not follow them depending on the rendering context — this is not documented clearly.What Should You Take From This Statement to Adjust Your Practices?
Martin Splitt recalls an obvious point: before subscribing to a tool, check what your browser already offers. It's a good habit for training juniors or for quick troubleshooting on the go.
But don't turn this advice into your sole method. Redirect chains cost response time and crawl budget — you must map them at the site scale, not page by page. An automated crawler remains essential for cross-referencing redirects, internal links, canonicals, and statuses. DevTools complement this arsenal, they don't replace it.
Practical impact and recommendations
How Do You Use DevTools to Diagnose a Suspicious Redirect?
Open the page in question with DevTools open (F12), Network tab active. Check Preserve log so entries don't disappear during a redirect. Reload the page (Cmd+R or Ctrl+R).
Identify the main HTML document line (Type = document). If Status shows 301 or 302, click the line, open Headers, and read the Location: value in the Response Headers. This URL is the destination of the first redirect. If you see multiple successive lines with 3xx statuses, you have a chain — each jump costs time and dilutes PageRank.
To simulate Googlebot: still in Network, open the three-dot menu (⋮), select Network conditions, uncheck "Use browser default", and paste the Googlebot User-Agent (Mozilla/5.0 (compatible; Googlebot/2.1; +http://www.google.com/bot.html)). Reload and compare statuses — if a 301 appears only for Googlebot, you have cloaking or a conditional redirect to investigate.
What Mistakes Must You Absolutely Avoid?
Don't rely solely on the final status displayed in the browser address bar. A page may load correctly (200) after three invisible redirects — the user sees nothing, but Googlebot wastes time and crawl budget.
Avoid redirect chains beyond two jumps. Google typically follows up to 5 redirects, but each hop slows rendering and weakens SEO juice transfer. If A redirects to B which redirects to C, fix A to point directly to C.
Don't confuse 301 (permanent) and 302 (temporary). A 302 tells Google to keep the source URL in the index; a 301 asks it to replace it with the destination. If you're permanently migrating a page, use a 301 — a 302 delays or prevents signal consolidation.
What Should You Concretely Implement on Your Site?
- Audit all redirects with a crawler (Screaming Frog, OnCrawl, Botify) to detect chains and loops at scale.
- Use DevTools (Network tab) to diagnose a single URL or validate a fix in real time.
- Check HTTP statuses for Googlebot via DevTools (Network conditions) or via
curl -I -A "Googlebot"on the command line. - Eliminate redirect chains: if A → B → C, make A point directly to C.
- Favor 301s for permanent migrations, reserve 302s for tests or temporary redirects (promotions, events).
- Monitor redirects after each deployment or URL structure change — a misconfigured htaccess can generate invisible loops.
- Document conditional redirects (User-Agent, language, geo) to avoid surprises during an audit or migration.
❓ Frequently Asked Questions
Les DevTools remplacent-ils Screaming Frog pour auditer les redirections ?
Comment repérer une chaîne de redirections dans l'onglet Network ?
Les redirections JavaScript apparaissent-elles dans le Network ?
Peut-on simuler Googlebot dans les DevTools ?
Combien de redirections Google accepte-t-il de suivre ?
🎥 From the same video 10
Other SEO insights extracted from this same Google Search Central video · published on 29/11/2022
🎥 Watch the full video on YouTube →
💬 Comments (0)
Be the first to comment.