Official statement
Other statements from this video 7 ▾
- □ Comment structurer vos visualisations de données SEO pour exploiter vraiment vos analytics ?
- □ Pourquoi Google recommande-t-il d'analyser la Search Console par tranches de 7 jours ?
- □ Pourquoi Google recommande-t-il des visualisations simplifiées pour le monitoring SEO ?
- □ Comment exploiter pleinement le data blending pour enrichir vos analyses Search Console ?
- □ Comment analyser la performance Search Console pour Discover et Google News séparément ?
- □ Pourquoi les expressions régulières sont-elles indispensables pour analyser vos données Search Console dans Looker Studio ?
- □ Pourquoi Google insiste-t-il autant sur les clics et le CTR dans Search Console ?
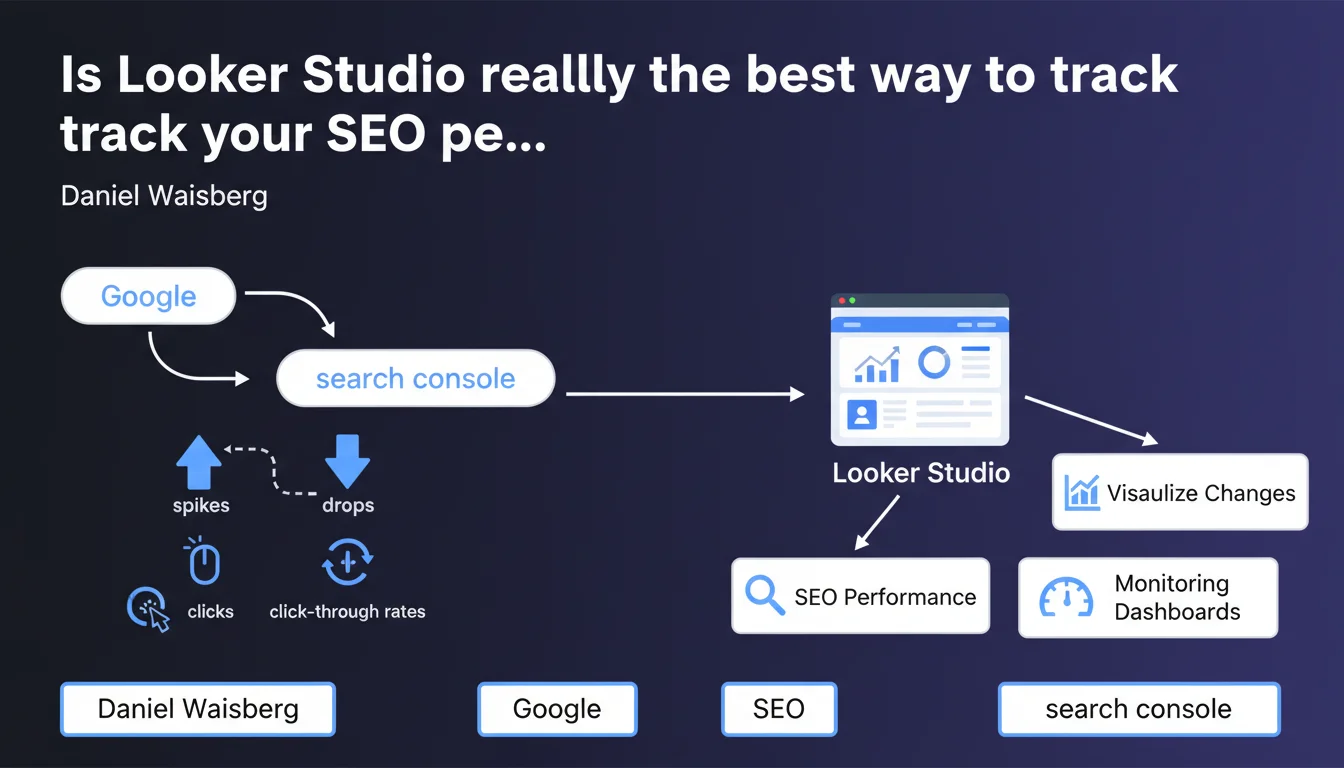
Google officially recommends connecting Search Console to Looker Studio to create personalized monitoring dashboards. The goal: quickly detect variations in organic traffic (clicks, CTR) across your strategic pages. An approach that offers more flexibility than the native GSC interface, but requires significant time investment for setup and configuration.
What you need to understand
Why is Google pushing Looker Studio for SEO monitoring?
The official reason comes down to one word: customization. The native Search Console interface displays data in a standardized way, but it doesn't allow you to easily cross-reference metrics according to your business priorities.
Looker Studio (formerly Data Studio) enables tailored views: you can isolate your conversion pages, monitor specific query segments, or compare the performance of different content categories. All in shared dashboards with your teams, automatically updated.
What Search Console data can you leverage in Looker Studio?
The native Search Console → Looker Studio connector exposes standard metrics: clicks, impressions, average CTR, average position. You can segment them by page, query, device, and country.
But be careful: granularity is limited by Google's privacy thresholds. If a query generates few impressions, it won't appear. And like in GSC, you only retrieve 1,000 rows per dimension — a ceiling that can be frustrating for large sites.
Is it really more effective than the standard Search Console interface?
For daily monitoring, yes. A well-built dashboard lets you spot a traffic drop on a priority category at a glance, whereas GSC requires navigating between multiple tabs.
For in-depth analysis, it's more nuanced. Looker Studio doesn't change the source data — if information doesn't exist in GSC, it won't magically appear in your dashboard.
- Main gain: quick visual alerts on organic traffic trends
- Major limitation: you remain constrained by Search Console filters and thresholds
- Hidden cost: time spent configuring and maintaining custom dashboards
- Credible alternative: third-party tools (SEMrush, Ahrefs, Botify) sometimes offer superior analytical depth, but at a cost
SEO Expert opinion
Is this recommendation consistent with practices observed in the field?
Absolutely. Mature SEO teams are already using Looker Studio — or equivalent solutions — to centralize their KPIs. Connecting GSC, Analytics, rank tracking data, and crawl information in a single dashboard quickly becomes essential when managing multiple sites or verticals.
What stands out is that Google is formalizing this practice in official communications. This suggests the company doesn't plan to significantly enhance the native Search Console interface in the short term — or at least, not enough to compete with custom dashboards.
What nuances should be added to this statement?
First point: Looker Studio is not a magic solution. If your Search Console data is limited (new site, low query volume), you won't gain anything by complicating your stack with an additional tool.
Second point: Google doesn't mention data latency. The Search Console → Looker Studio connector sometimes presents a 24 to 48-hour delay. For critical monitoring (such as manual penalties or major technical issues), the native GSC interface remains more responsive. [To verify]: Google doesn't officially document this delay, but field feedback is consistent.
Third point: this recommendation sidesteps the question of data governance. Who has access to the dashboards? Who validates the displayed metrics? In large organizations, a poorly configured dashboard can create more confusion than clarity.
In what cases is this approach not relevant?
If you manage a site with fewer than 1,000 pages with stable traffic, the Search Console interface is more than sufficient. Looker Studio adds a layer of complexity you don't need.
Similarly, if your priority is behavioral analysis (user journeys, conversion), Analytics 4 or heatmap tools will provide more value. GSC via Looker Studio remains limited to organic search performance — it's a partial view of the funnel.
Practical impact and recommendations
What do you need to do concretely to set up this monitoring?
First step: connect your Search Console property to Looker Studio via the official connector. You'll need owner or full user rights on the relevant GSC property.
Next, define your monitoring priorities. Which pages generate the most revenue? Which query segments align with your core business? No need to display everything — a good dashboard focuses on 3 to 5 critical KPIs.
Set up visual alerts: weekly click variations, sharp CTR drops, strategic pages falling out of the top 10. Looker Studio allows conditional formatting to flag anomalies.
What mistakes should you avoid during setup?
Don't multiply dimensions in the same chart. Simultaneously crossing country, device, page, and query makes the reading incomprehensible — and slows dashboard loading.
Avoid freezing your date ranges. A relevant dashboard automatically compares the last 7 days vs. the previous 7 days, or the last 30 days vs. the equivalent period last year (watch out for seasonal effects).
Don't neglect documentation. If you leave the project or a colleague takes over monitoring, they should understand in 5 minutes what each chart represents and why these metrics were chosen.
How do you verify your dashboard is working correctly?
Occasionally compare the figures displayed in Looker Studio with those in the native Search Console interface. Minor discrepancies are normal (rounding, filters), but a difference greater than 10% signals a configuration problem.
Test responsiveness to events: after content updates or technical changes, verify that variations appear in your dashboard within expected timeframes (typically 24-48 hours).
- Connect Search Console to Looker Studio via the official Google connector
- Identify 3 to 5 critical KPIs aligned with your business objectives (conversion pages, strategic query segments)
- Create comparative views (week N vs. N-1, month M vs. M-1 previous year)
- Configure visual alerts for unusual variations in clicks or CTR
- Document each chart to facilitate handover to other teams
- Regularly verify data consistency with the native GSC interface
- Plan for someone to maintain and evolve the dashboard
❓ Frequently Asked Questions
Looker Studio est-il gratuit pour connecter Search Console ?
Peut-on combiner Search Console et Google Analytics dans le même dashboard ?
Les données Looker Studio sont-elles actualisées en temps réel ?
Faut-il des compétences techniques pour créer un dashboard Search Console dans Looker Studio ?
Combien de temps faut-il pour configurer un dashboard Search Console efficace ?
🎥 From the same video 7
Other SEO insights extracted from this same Google Search Central video · published on 15/03/2023
🎥 Watch the full video on YouTube →
💬 Comments (0)
Be the first to comment.