Official statement
Other statements from this video 7 ▾
- □ Faut-il vraiment utiliser Looker Studio pour monitorer ses performances SEO ?
- □ Pourquoi Google recommande-t-il d'analyser la Search Console par tranches de 7 jours ?
- □ Pourquoi Google recommande-t-il des visualisations simplifiées pour le monitoring SEO ?
- □ Comment exploiter pleinement le data blending pour enrichir vos analyses Search Console ?
- □ Comment analyser la performance Search Console pour Discover et Google News séparément ?
- □ Pourquoi les expressions régulières sont-elles indispensables pour analyser vos données Search Console dans Looker Studio ?
- □ Pourquoi Google insiste-t-il autant sur les clics et le CTR dans Search Console ?
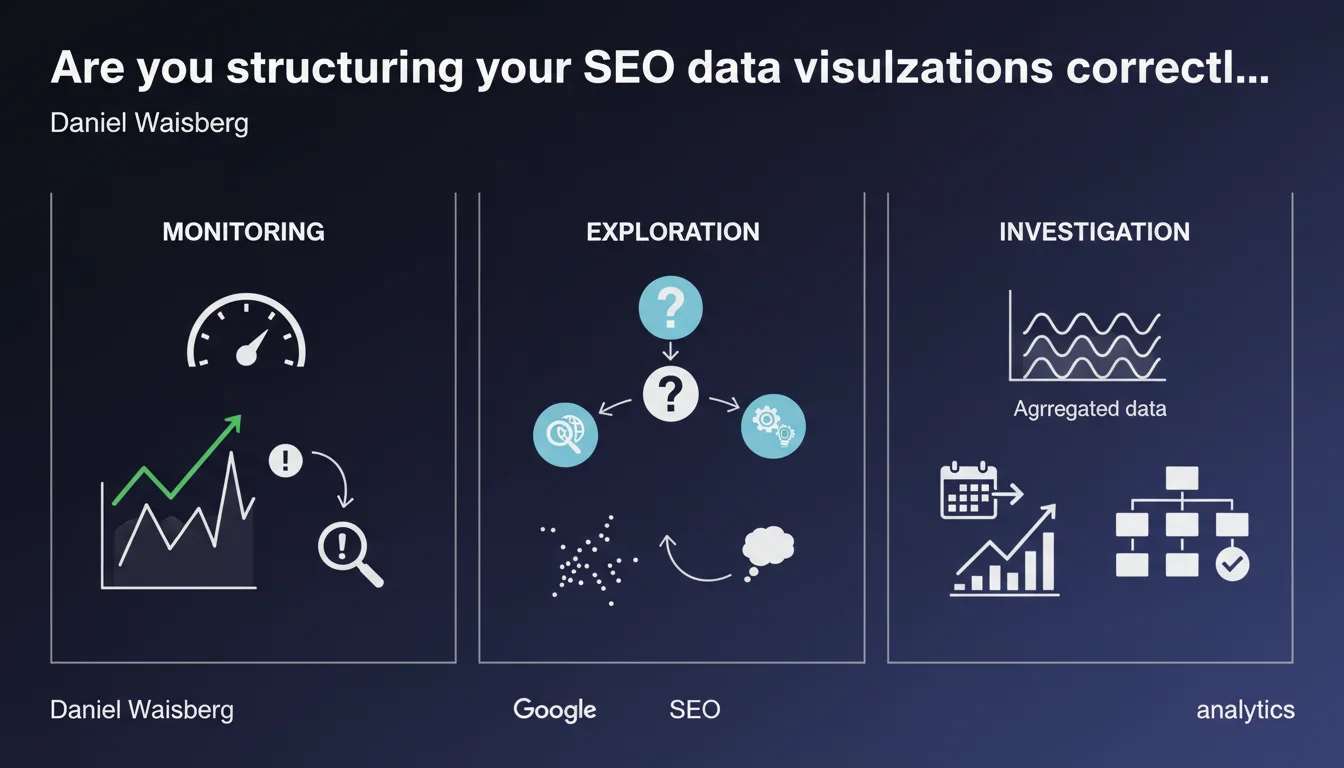
Google identifies three distinct uses for SEO data visualizations: monitoring (rapid detection of anomalies), exploration (understanding the causes of a problem), and investigation (identifying patterns in aggregated data). Each use case requires an adapted visualization type and a specific methodological approach.
What you need to understand
Why does Google distinguish three different use cases?
Most SEOs simply open Search Console and stare at charts without really defining what they're looking for. Google is formalizing here an essential distinction: looking at data without a clear objective is wasted time.
Each use case corresponds to a different phase of analysis. Monitoring helps you detect that a problem exists (traffic drop, unusual spike). Exploration comes into play when you know there's a problem and need to understand its source. Investigation, on the other hand, is about identifying trends over the long term to anticipate or adjust your strategy.
What does this actually change in your analytical approach?
Too many SEO dashboards mix everything together: monitoring metrics (daily traffic) with investigation metrics (category evolution over 12 months). Result: you see neither urgent alerts nor structural trends.
By clearly separating these three uses, you gain responsiveness (monitoring alerts you quickly) and analytical depth (exploration and investigation give you the "why"). This is particularly critical on sites with thousands of pages where a localized anomaly can get lost in the averages.
Is this distinction really new or just a formalization of existing practices?
Honestly? Google isn't revolutionizing anything here. Web analysts have been applying this logic for years already. What's changing is that Google is formalizing this methodological segmentation, which should influence the evolution of tools (including Search Console).
The real question is whether Google will adapt its interface accordingly — currently, Search Console happily mixes these three uses without clear distinction.
- Monitoring: rapidly detecting a change in data (alerts, thresholds, period-over-period comparisons)
- Exploration: understanding why a problem occurs (drill-down, segmentation, dimension crossing)
- Investigation: identifying trends and patterns in aggregated data (long-period views, correlations, clustering)
- Each use case requires different visualizations and an adapted methodological approach
SEO Expert opinion
Does this distinction truly reflect the on-the-ground needs of SEOs?
Yes, but with one major limitation: Google doesn't provide tools suited to these three uses. Search Console remains very focused on basic monitoring, with limited exploration capabilities (no advanced segmentation, no automatic correlations).
For serious investigation, you're forced to export to BigQuery, Data Studio (sorry, Looker Studio), or third-party tools. Which means Google is theorizing a methodology... that it doesn't facilitate in its own main tool. The contradiction is delicious.
What pitfalls should you avoid when applying this approach?
The main risk: over-investing in monitoring at the expense of investigation. Many SEOs spend their time watching daily fluctuations without ever taking time to analyze structural trends over 6-12 months.
Another pitfall: believing that a single visualization can serve multiple uses. A dashboard mixing real-time alerts and annual trends ends up being good for neither. Physically separate your dashboards by use case — it seems obvious, but very few actually do it.
In what cases does this methodology show its limitations?
On small sites (fewer than 1,000 visits/day), the distinction between exploration and investigation becomes blurry — you don't have enough volume for statistically significant analysis. Monitoring remains your only truly relevant use case.
Also, this approach assumes you have the time and analytical skills. [To verify] but I suspect fewer than 20% of SEOs systematically use exploration and investigation — most stay at the basic monitoring level.
Practical impact and recommendations
How do you concretely structure your dashboards according to these three uses?
Monitoring dashboard: daily or weekly metrics, alerts on abnormal variations (+/- 20% vs previous period), focus on critical KPIs (total organic traffic, average top 10 positions, click-through rate). Reviewable in less than 30 seconds.
Exploration dashboard: drill-down capability by landing page, category, search intent. Multiple comparisons (desktop vs mobile, branded vs non-branded, query types). This is your investigation tool when an alert triggers.
Investigation dashboard: monthly or quarterly views, long-term evolutions, metric correlations (positions vs CTR, new pages vs category growth). Using clustering techniques to identify non-obvious patterns.
What absolute mistakes should you avoid?
Don't multiply tools if you lack the discipline to consult them. Better to have one well-configured monitoring dashboard than a complex ecosystem no one actually uses.
Avoid confusing correlation with causation in investigation. Just because two metrics move together doesn't mean there's a cause-and-effect relationship — a classic error leading to hasty decisions.
How do you verify your analytics setup is coherent with this approach?
Ask yourself these questions: how much time do you spend on each use? If you spend 80% of your time on monitoring and 5% on investigation, you're probably missing strategic levers on your site.
Also test the responsiveness of your monitoring: if you discover a traffic drop 3 days after it happened, your alert system is failing. Monitoring's goal is detection within 24 hours.
- Create three distinct visualization environments (monitoring, exploration, investigation) rather than an all-in-one dashboard
- Configure automatic alerts on your monitoring metrics (variations > 15-20%, critical thresholds)
- Schedule monthly investigation sessions to identify long-term trends — don't just react
- Document your exploration processes when problems occur (verification checklists) to save time
- Train your team to distinguish the three uses — everyone must understand when to use which tool
- Regularly export your Search Console data to BigQuery if you want to do serious investigation
❓ Frequently Asked Questions
Quels outils permettent vraiment de faire les trois usages identifiés par Google ?
Faut-il vraiment trois dashboards séparés ou un seul bien conçu suffit ?
Quelle fréquence de consultation pour chaque usage ?
Cette approche s'applique-t-elle aussi à Google Analytics ou seulement Search Console ?
Combien de temps faut-il pour mettre en place cette structure analytique complète ?
🎥 From the same video 7
Other SEO insights extracted from this same Google Search Central video · published on 15/03/2023
🎥 Watch the full video on YouTube →
💬 Comments (0)
Be the first to comment.