Official statement
Other statements from this video 8 ▾
- □ La latence tue-t-elle vraiment vos conversions et votre SEO ?
- □ La performance mobile est-elle vraiment un facteur de classement déterminant ?
- □ Les GIF animés plombent-ils vraiment votre SEO et vos Core Web Vitals ?
- □ Le lazy loading d'images est-il vraiment indispensable pour votre SEO ?
- □ Vos bundles JavaScript plombent-ils vraiment vos Core Web Vitals ?
- □ Faut-il vraiment analyser ses bundles JavaScript avec webpack pour performer en SEO ?
- □ 15% de vitesse mobile en plus = combien d'utilisateurs gardés sur vos pages produits ?
- □ Pourquoi l'optimisation de performance prend-elle autant de temps en SEO ?
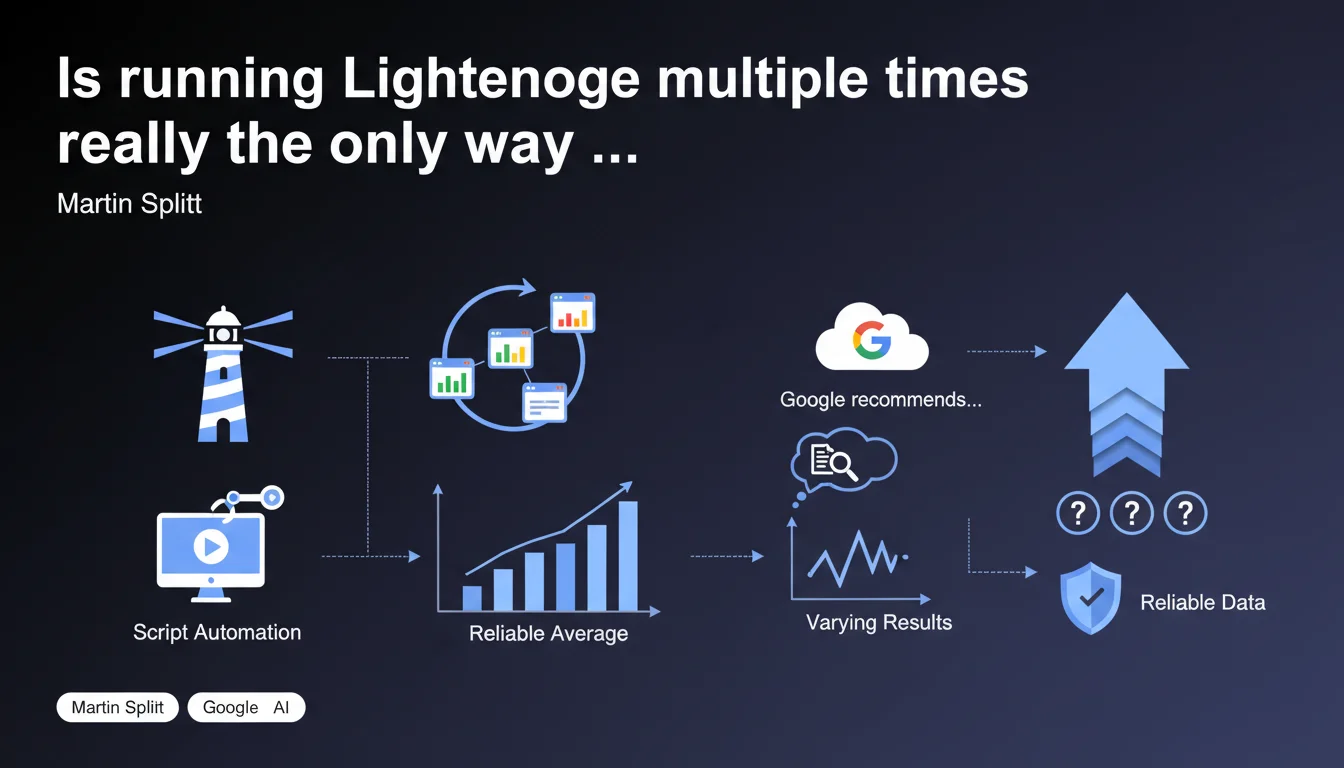
Google recommends executing Lighthouse multiple times to obtain reliable performance data, as results naturally fluctuate between each test. Script automation becomes essential for calculating representative averages and avoiding decisions based on a single misleading snapshot.
What you need to understand
Why will a single Lighthouse audit never be enough?
Lighthouse measures performance under constantly varying conditions: network state, CPU load, browser cache, active extensions. A score of 85 can drop to 72 on the next test without your site having changed.
Martin Splitt emphasizes this point because too many practitioners make optimization decisions based on a single audit. It's like judging a runner's health on a single pulse check — context skews everything.
How many tests should you run to have confidence in the results?
Google doesn't provide a magic number, but field experience suggests a minimum of 5 to 10 executions to uncover a reliable trend. Standard deviation becomes as important as the average: if your scores oscillate between 50 and 90, you have a performance stability problem.
Script automation (Lighthouse CI, CLI with headless options) allows you to run these test batteries without manual intervention. It's the only scalable approach for monitoring multiple critical URLs.
- A single audit = non-representative snapshot of actual performance
- Natural variations can reach 15-20 points on the same site
- Automation enables statistically valid averages
- Most unstable metrics: TBT, CLS (many external dependencies)
- Recommended infrastructure: dedicated server with controlled network conditions
What's the difference between Lighthouse and real-world CrUX data?
Lighthouse operates in a controlled environment (lab data), while CrUX collects metrics from real users. Both are complementary, not interchangeable.
Lighthouse allows you to identify the precise causes of a problem before production deployment. CrUX shows what your actual visitors experience, with their hardware, their connection, their extensions. A good Lighthouse score is not a guarantee of good CrUX — but a poor Lighthouse score almost always predicts real-world issues.
SEO Expert opinion
Is this recommendation consistent with practices observed in the field?
Absolutely, and that's even an understatement. Teams that deploy Core Web Vitals optimizations based on a single Lighthouse audit regularly fail. The classic pattern: you improve LCP by 200ms in the lab, then CrUX doesn't budge for 28 days.
The problem — Google doesn't state this frankly enough — is that Lighthouse's default test conditions are too optimistic. Network throttling at 4G, modern desktop CPU, empty cache but clean browser. Your real users arrive with 3G, a Redmi Note 7, and 12 active Chrome extensions.
What nuances should be applied to this statement?
Splitt talks about automation, but he omits a critical detail: where you run these tests drastically changes the results. Lighthouse from your MacBook Pro on fiber WiFi versus from a Google Cloud VM in Belgium is a completely different game.
For truly actionable data, you need to:
- Test from multiple geographic locations (your CDN doesn't perform the same everywhere)
- Use custom throttling profiles that reflect your actual audience (PageSpeed Insights API exposes these options)
- Systematically compare with WebPageTest which offers more granular test conditions
[To verify] Google never specifies how many audits are necessary to achieve statistical significance. Five tests? Ten? Twenty? The silence on this point is suspicious — probably because the answer depends too heavily on the intrinsic variability of each site.
In what cases is this approach insufficient?
Lighthouse remains a technical diagnostic tool. It detects issues with critical rendering, blocking JavaScript, unoptimized resources. But it doesn't measure real user experience with dynamically loaded content.
And let's be honest: many e-commerce sites have catastrophic Lighthouse scores (30-40) but convert very well because their audience is captive. SEO, however, shows no mercy — Google prioritizes user experience in its rankings, not your conversion rate.
Practical impact and recommendations
What concrete steps must you take to automate Lighthouse audits?
The minimal solution: install Lighthouse CI and integrate it into your CI/CD pipeline. Each deployment triggers a series of audits on your strategic pages (homepage, category pages, flagship product sheets).
Basic configuration via lighthouserc.json:
- Define 5 to 10 runs per URL to calculate medians
- Specify performance budgets (thresholds below which the build fails)
- Exclude overly volatile metrics if your infrastructure is unstable (TBT, CLS)
- Configure network/CPU throttling to reflect your P75 audience (Analytics data)
- Store results in a TimeSeries database for historical tracking
Alternatively, the PageSpeed Insights API lets you query official CrUX data plus a Lighthouse audit in a single request. Limit: 25,000 requests/day with free API key — more than enough to monitor 50-100 URLs daily.
What errors should you avoid when interpreting results?
Never compare Lighthouse audits conducted under different conditions. Testing locally then in production via PageSpeed Insights is comparing apples and oranges. Google's servers use specific throttling profiles, US geolocation, and different caching.
Another classic pitfall: focusing exclusively on the overall score instead of dissecting individual metrics. A site can score 75/100 with a catastrophic LCP (4.5s) but excellent TBT — the overall score masks the critical problem.
- Always analyze individual metrics (LCP, TBT, CLS, FCP, SI)
- Track evolution over time, not just snapshot in time
- Correlate with CrUX data over 28 days for field validation
- Identify anomalies: a score drop of 20 points = warning signal
How do you verify that your optimizations produce real impact?
The fatal mistake: deploy an optimization, observe a Lighthouse improvement, and move on. The real test is the impact on CrUX after 28 days (field data refresh delay).
Robust workflow:
- Baseline: 10 Lighthouse audits before modification
- Deploy the optimization with A/B testing if possible
- New series of 10 Lighthouse audits post-deployment
- Wait 28 days for CrUX validation
- If CrUX doesn't move despite lab improvement → identify the gap (CDN cache, actual user behavior, device mix)
Automating Lighthouse audits via script is now an industry standard for any site serious about performance. A single test = blind decision. An average of 10 runs = actionable baseline. Lab + field correlation over 28 days = proof of effectiveness.
This approach requires solid technical infrastructure and pointed expertise in metric interpretation. If your team lacks time or skills to implement rigorous monitoring, a specialized SEO agency focused on web performance can structure this approach and save you months of methodological wandering.
❓ Frequently Asked Questions
Combien de tests Lighthouse faut-il lancer pour obtenir des données fiables ?
Peut-on se fier uniquement à Lighthouse pour optimiser les Core Web Vitals ?
Quelle différence entre lancer Lighthouse en local et via PageSpeed Insights ?
Lighthouse CI remplace-t-il les outils de monitoring RUM ?
Pourquoi mes scores Lighthouse varient-ils autant entre deux tests successifs ?
🎥 From the same video 8
Other SEO insights extracted from this same Google Search Central video · published on 29/12/2022
🎥 Watch the full video on YouTube →
💬 Comments (0)
Be the first to comment.