Official statement
Other statements from this video 10 ▾
- □ Pourquoi Google impose-t-il trois rapports de performance distincts dans Search Console ?
- □ Faut-il vraiment filtrer vos données par type de recherche dans Search Console ?
- □ Comment identifier et résoudre les problèmes d'indexation sur vos pages stratégiques ?
- □ La navigation interne suffit-elle vraiment à garantir l'indexation de vos pages stratégiques ?
- □ Un CTR faible signifie-t-il vraiment que vos snippets manquent d'attractivité ?
- □ Pourquoi vos données Google News ne remontent-elles pas dans la Search Console ?
- □ Pourquoi Google Search Console masque-t-il les données de requêtes dans le rapport Google News ?
- □ Pourquoi le rapport Discover n'apparaît-il pas dans votre Search Console ?
- □ L'option Most Recent Date permet-elle vraiment de détecter les tendances en temps réel ?
- □ Pourquoi comparer Search, News et Discover change votre stratégie de contenu ?
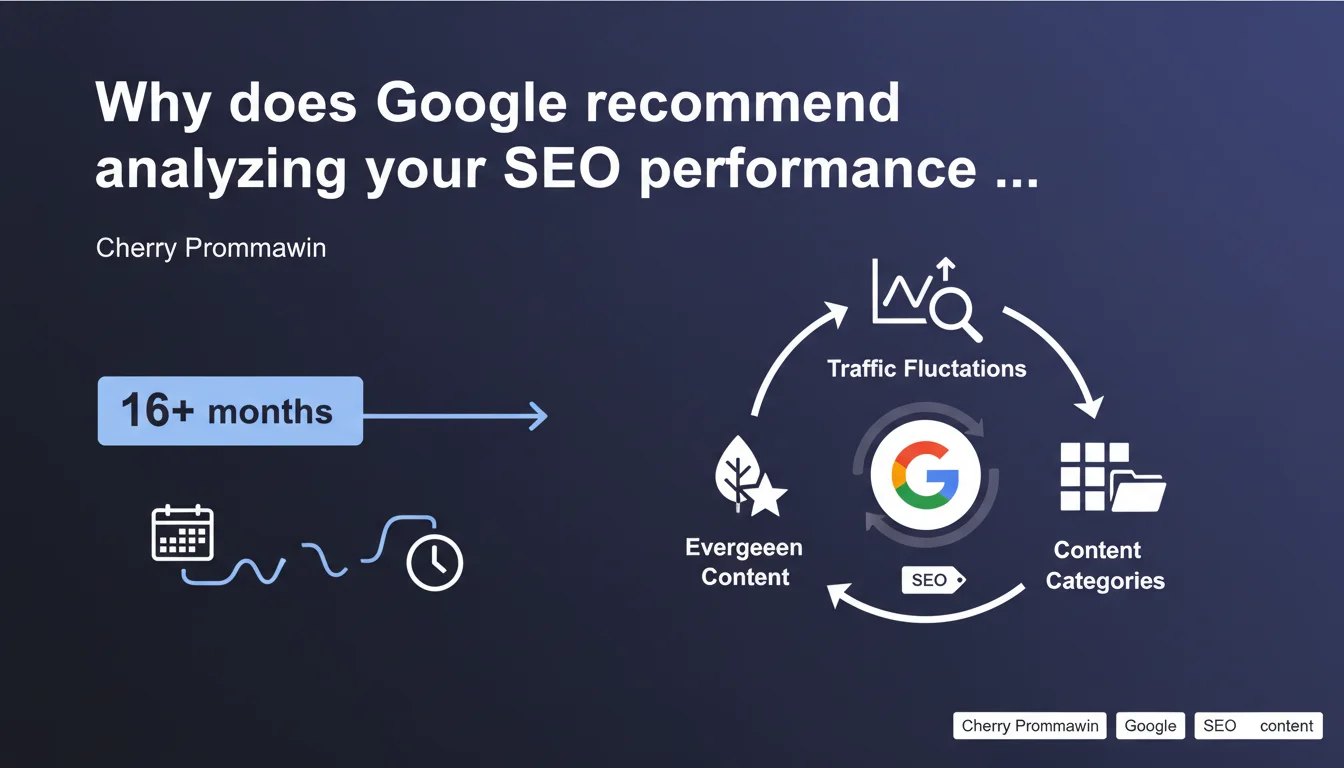
Google recommends extending your SEO performance analysis to a minimum of 16 months using Search Console's date filter to better identify traffic fluctuations and spot evergreen content. This timeframe allows you to move beyond annual seasonal cycles and gain a reliable strategic perspective. The goal: distinguish structural trends from temporary variations.
What you need to understand
Why 16 months instead of 12 or 18?
The duration of 16 months is not arbitrary. It allows you to capture a full year plus an additional quarter, providing a robust comparison baseline for analyzing year-over-year evolution. A 12-month cycle risks masking certain variations—especially if your site experiences pronounced seasonal fluctuations.
With 16 months, you can compare January Year N to January Year N-1 while still having an additional 4 months of historical perspective. This allows you to smooth out one-off anomalies (algorithm changes, exceptional events) and better determine what represents a lasting trend versus a temporary setback.
How does this change the way you identify evergreen content?
Evergreen content is supposed to generate consistent traffic regardless of season. But over 12 months, it's difficult to distinguish truly evergreen content from content that simply benefits from favorable seasonality.
Over 16 months, you can verify whether an article maintains its traffic month after month, year after year. If a piece of content loses 40% of visits between January Year N and January Year N-1, it's probably not evergreen—or it needs an update.
How does this timeframe help you identify your site's main content categories?
By observing performance over 16 months, you detect which categories generate stable traffic and which are subject to seasonal peaks or troughs. This allows you to adjust your editorial strategy and resource allocation based on what actually delivers value in the long term.
Some categories may appear strong over 3-6 months, then collapse. Others, conversely, take time to build momentum but show consistent growth. Without sufficient historical perspective, you risk betting on the wrong priorities.
- A 16-month period allows you to move past annual seasonal cycles
- It enables year-over-year comparison with a 4-month buffer
- Evergreen content stands out more clearly over this duration than over 12 months
- Main content categories emerge more clearly when temporary variations are smoothed out
- It reduces the risk of strategic decisions based on temporary anomalies
SEO Expert opinion
Is this recommendation new, or is Google stating the obvious?
Let's be honest: any serious SEO analyst is already looking at their data across multiple years. Google's recommendation of 16 months isn't revolutionary, but it has merit in establishing a minimum standard that Google officially endorses. Too many clients and beginners still rely on 30 or 90-day analysis windows, which is catastrophic for any strategic decision-making.
The problem is that Google doesn't clarify when this duration falls short. For an e-commerce site with multiple seasonal peaks, 16 months remains on the low side. For B2B media with long sales cycles, you'd be better off targeting 24 months minimum. [To verify]: Google provides no numerical justification or case study to support this specific choice of 16 months.
What are the limitations of this approach in Search Console?
Search Console displays a maximum of 16 months of data in its standard interface, which likely explains this recommendation. But this technical limitation shouldn't dictate your analysis strategy. For a complete picture, you must regularly export your data and cross-reference it with Google Analytics 4, your BI tools, and your CRM data.
Another point: Search Console samples data beyond certain volume thresholds. If your site generates millions of impressions, the figures displayed over 16 months may be partially truncated. You must therefore cross-reference with other sources to validate your conclusions.
In what cases is a 16-month timeframe insufficient?
For sites in sectors with high seasonality (travel, holiday retail, gardening), 16 months often isn't enough to capture all nuances. A harsh winter or an ephemeral trend can skew your analysis. You then need to go back 24 or 36 months for a reliable perspective.
Similarly, for sites that have undergone migrations, redesigns, or penalties, 16 months may encompass non-comparable periods. In such cases, it's more appropriate to segment your analysis before/after the event rather than blindly apply a fixed window.
Practical impact and recommendations
What should you do concretely in Search Console?
Go to the Performance tab in Search Console, then click the Date filter. Select "Compare" and choose a 16-month range (for example, January 1 Year N-1 to April 30 Year N). Enable comparison with the previous period to see year-over-year evolution.
Export this data regularly (at least once per quarter) into a spreadsheet or BI tool. This allows you to build a history extending beyond 16 months and cross-reference with other sources (GA4, server logs, CRM).
What mistakes should you avoid when conducting this analysis?
Don't draw hasty conclusions based on a single spike or dip. A piece of content may surge one month due to a one-off event (news, buzz, viral backlink) then drop back. That doesn't automatically make it evergreen or a failure.
Also avoid comparing non-homogeneous periods. If you did a migration in March, comparing January-April Year N to January-April Year N-1 makes no sense. Segment before/after the migration and analyze separately. Finally, don't settle for aggregate metrics: drill down to the page, query, and category level to identify true drivers.
- Enable the Date filter on 16 months in Search Console
- Compare with the previous period for a year-over-year analysis
- Export your data regularly to build a lasting history
- Cross-reference Search Console with GA4, server logs, and CRM
- Segment analyses before/after major events (migration, redesign, penalty)
- Drill down to page and query level, not just site-wide metrics
- Don't confuse one-off spikes with structural trends
❓ Frequently Asked Questions
Pourquoi Google recommande-t-il précisément 16 mois et pas 12 ou 24 ?
Est-ce que 16 mois suffisent pour tous les types de sites ?
Comment exporter les données Search Console au-delà de 16 mois ?
Quels outils croiser avec Search Console pour une analyse complète ?
Comment identifier un vrai contenu evergreen sur 16 mois ?
🎥 From the same video 10
Other SEO insights extracted from this same Google Search Central video · published on 23/05/2023
🎥 Watch the full video on YouTube →
💬 Comments (0)
Be the first to comment.