Official statement
Other statements from this video 11 ▾
- □ Le JavaScript est-il vraiment un frein aux performances SEO de votre site ?
- □ Pourquoi trop de fichiers JavaScript nuisent-ils à vos performances SEO ?
- □ Faut-il vraiment regrouper ses fichiers JavaScript pour améliorer son SEO ?
- □ HTTP/2 rend-il obsolète la concaténation de fichiers JavaScript pour le SEO ?
- □ Faut-il vraiment limiter le nombre de domaines pour charger vos fichiers JavaScript ?
- □ Comment éliminer le JavaScript inefficace qui plombe vos Core Web Vitals ?
- □ Les passive listeners peuvent-ils vraiment booster vos Core Web Vitals ?
- □ Pourquoi le JavaScript non utilisé plombe-t-il vos Core Web Vitals même s'il n'est jamais exécuté ?
- □ Le tree shaking JavaScript est-il vraiment efficace pour améliorer les performances SEO ?
- □ Faut-il vraiment compresser tous vos fichiers JavaScript pour améliorer votre SEO ?
- □ Pourquoi Google insiste-t-il sur les en-têtes de cache pour JavaScript ?
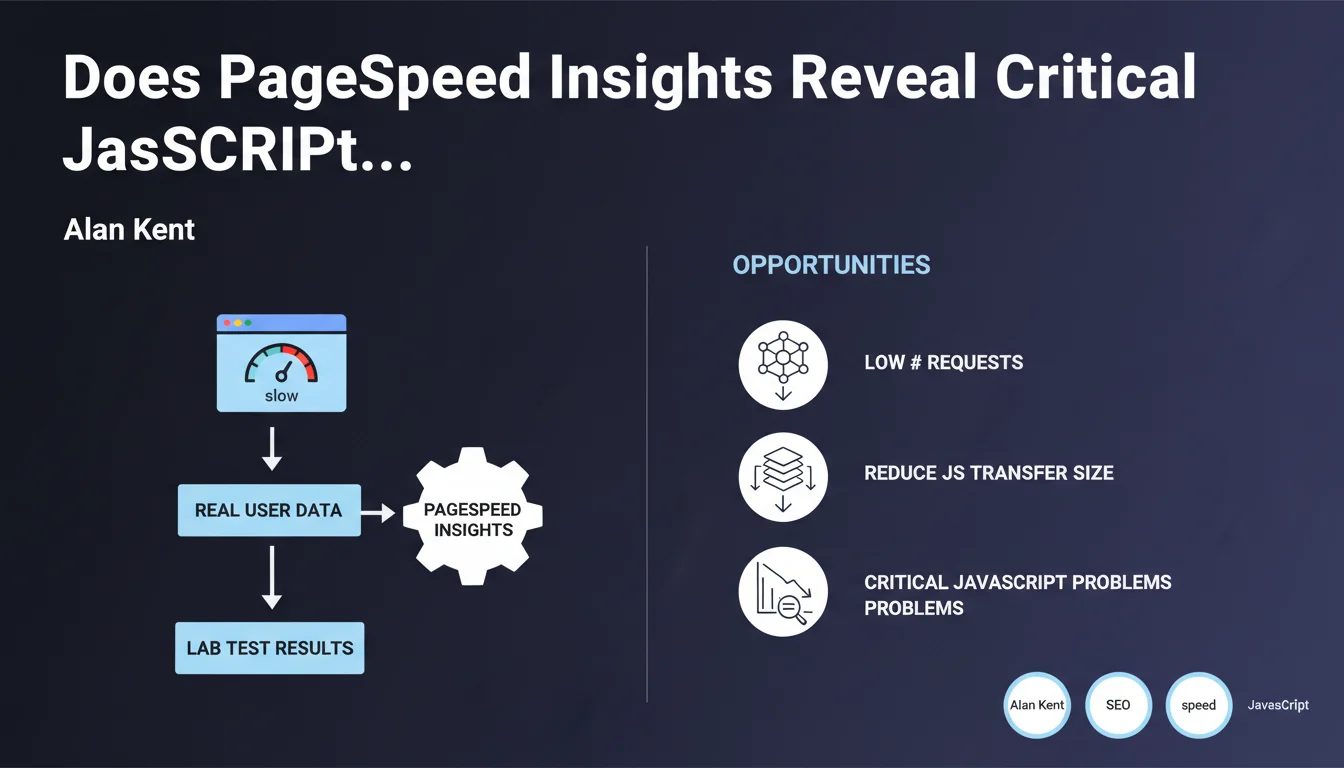
Google recommends using PageSpeed Insights to identify JavaScript issues via the 'Opportunities' section, focusing on reducing the number of requests and the size of JavaScript transfers. The tool combines real user data (CrUX) and lab tests (Lighthouse) to provide a complete picture. Practically speaking, this is where Google tells you where to look to optimize your scripts.
What you need to understand
Why PageSpeed Insights Over Other Tools?
PageSpeed Insights combines two distinct data sources: field data (Chrome User Experience Report) reflecting the real experience of your visitors, and lab tests (Lighthouse) that simulate controlled conditions. This dual approach allows you to distinguish structural problems in your code from contextual issues related to your users.
The 'Opportunities' section lists recommendations ranked by potential impact. For JavaScript, two main axes dominate: keeping the number of requests low and reducing transfer size. These two metrics directly impact Time to Interactive and Total Blocking Time, both components of Core Web Vitals.
What Does "Keep the Number of Requests Low" Really Mean?
Each JavaScript file triggers an HTTP request. The more you fragment your code, the more time the browser spends negotiating connections, even with HTTP/2. Google's recommendation aims to intelligently bundle your scripts: bundling to reduce roundtrips, but without creating a monolith that blocks all initial rendering.
Reducing transfer size means minification, tree-shaking (eliminating dead code), and compression (Gzip/Brotli). The goal: transfer fewer bytes over the network. Keep in mind — a heavy file that's well-compressed can sometimes perform better than 10 small unoptimized files.
What Are the Limitations of This Approach?
PageSpeed Insights tests from a standardized environment (simulated desktop/mobile, 4G connection). Your real users might be browsing on rural 3G or premium WiFi. The recommendations remain valid, but the actual impact will vary depending on your audience.
Another point: PSI doesn't detect JavaScript errors that break business functionality. It measures performance, not functional correctness. A fast script that crashes in production is still a problem.
- PageSpeed Insights combines real data (CrUX) and controlled tests (Lighthouse)
- The Opportunities section prioritizes JavaScript optimizations by potential gain
- Two priority axes: reduce the number of requests and decrease transfer size
- Recommendations aim to improve TTI and TBT, components of Core Web Vitals
- The test environment remains standardized — actual results depend on your audience
SEO Expert opinion
Is This Statement Consistent with Real-World Practices?
Yes, but with an important caveat. Sites that mechanically follow all PSI recommendations without understanding their context sometimes end up with functional regressions. I've seen e-commerce sites aggressively split their JavaScript to turn green on PSI, at the cost of a shopping cart that loads in three successive waves — technically fast, but a catastrophic user experience.
Google's recommendation is sound. But it assumes you master loading order and dependencies between scripts. If your stack relies on React, Next.js or another modern framework, bundling is handled automatically — but you still need to configure code-splitting intelligently.
What Are the Gray Areas in This Recommendation?
Google doesn't specify the acceptable threshold for JavaScript requests. Five files? Ten? Fifteen if it's HTTP/2 with server push? The answer depends on your architecture, your CDN, your cache headers. PSI tells you to "reduce," but doesn't give you a specific target number. [To verify] on your own infrastructure.
Another unclear point: transfer size. A 200 KB file minified and compressed with Brotli might weigh 40 KB on the network. But if that file blocks initial rendering, it's still a problem. PSI measures transferred weight, not impact on the critical rendering path. It's up to you to distinguish blocking JavaScript from deferred JavaScript.
In What Cases Doesn't This Rule Apply?
If your site is a single-page application (SPA) like a dashboard or SaaS tool, the approach changes. You'll load a large initial bundle, then navigate client-side without reloading pages. PSI will give you a hard time on the first load, but the user experience will be smooth thereafter. In this case, optimize the Time to Interactive on first render, then focus on application metrics (responsiveness, API response times).
Another exception: high-traffic recurring-visitor sites. If 80% of your visitors return daily, they already have JavaScript cached. The impact of PSI recommendations will be marginal for them — focus instead on the experience of new visitors and strategic caching.
Practical impact and recommendations
What Should You Actually Do on Your Site?
Start by auditing your JavaScript with PageSpeed Insights, but also with the Coverage tool in Chrome DevTools (Sources tab > Coverage). This tool shows you what percentage of each JS file is actually executed on load. If you see 30-40% usage, that's dead code to eliminate.
Next, bundle the JavaScript critical for initial rendering into a single file, and defer everything else with async or defer. Analytics scripts, chatbots, tracking pixels have no reason to block content display. Use solutions like Google Tag Manager to load these scripts after user interaction.
For compression, verify that your server or CDN is properly sending Brotli (br) to browsers that support it. Brotli compresses 15-20% better than Gzip on JavaScript. If you're on Cloudflare, Fastly or AWS CloudFront, it's native. On a standard Apache or Nginx server, you need to enable it manually.
What Mistakes Should You Absolutely Avoid?
Don't fragment your JavaScript into dozens of micro-files under the pretext of "reducing the size of each transfer." You'll create a catastrophic waterfall where each script waits for the previous one. Prefer logical organization: one bundle for critical code, one for secondary features, one for third-party scripts.
Another trap: minifying without testing. Minification can break code that relies on specific variable or function names (some polyfills, some legacy frameworks). Always test in a staging environment with the same conditions as production.
Finally, don't focus solely on the PSI score. A site scoring 95/100 on PageSpeed but with a 70% bounce rate has a problem elsewhere. Core Web Vitals are one factor among many. Real user experience always beats an isolated metric.
- Audit JavaScript with PageSpeed Insights AND Chrome DevTools Coverage
- Bundle critical scripts together, defer the rest with async/defer
- Enable Brotli compression on your server or CDN
- Eliminate dead code detected by the Coverage tool (tree-shaking)
- Load third-party scripts (analytics, tracking, chatbots) after user interaction
- Test minification in staging before production deployment
- Measure actual impact on business metrics (bounce rate, conversions) alongside PSI scores
❓ Frequently Asked Questions
PageSpeed Insights détecte-t-il les erreurs JavaScript qui cassent des fonctionnalités ?
Faut-il viser un score de 100/100 sur PageSpeed Insights ?
Comment savoir si mes scripts tiers sont responsables des mauvais scores PSI ?
Quelle est la différence entre les données CrUX et Lighthouse dans PSI ?
Le code-splitting automatique des frameworks modernes suffit-il ?
🎥 From the same video 11
Other SEO insights extracted from this same Google Search Central video · published on 17/05/2022
🎥 Watch the full video on YouTube →
💬 Comments (0)
Be the first to comment.