Official statement
Other statements from this video 6 ▾
- □ Pourquoi exporter vos données Search Console peut transformer votre stratégie SEO ?
- □ Comment exploiter pleinement les exports de données dans Search Console ?
- □ Pourquoi Google limite-t-il l'export Search Console à seulement 1000 lignes ?
- □ Comment exploiter les données exportées de Search Console pour créer des tableaux de bord SEO sur mesure ?
- □ Comment analyser efficacement les performances SEO de chaque section de votre site ?
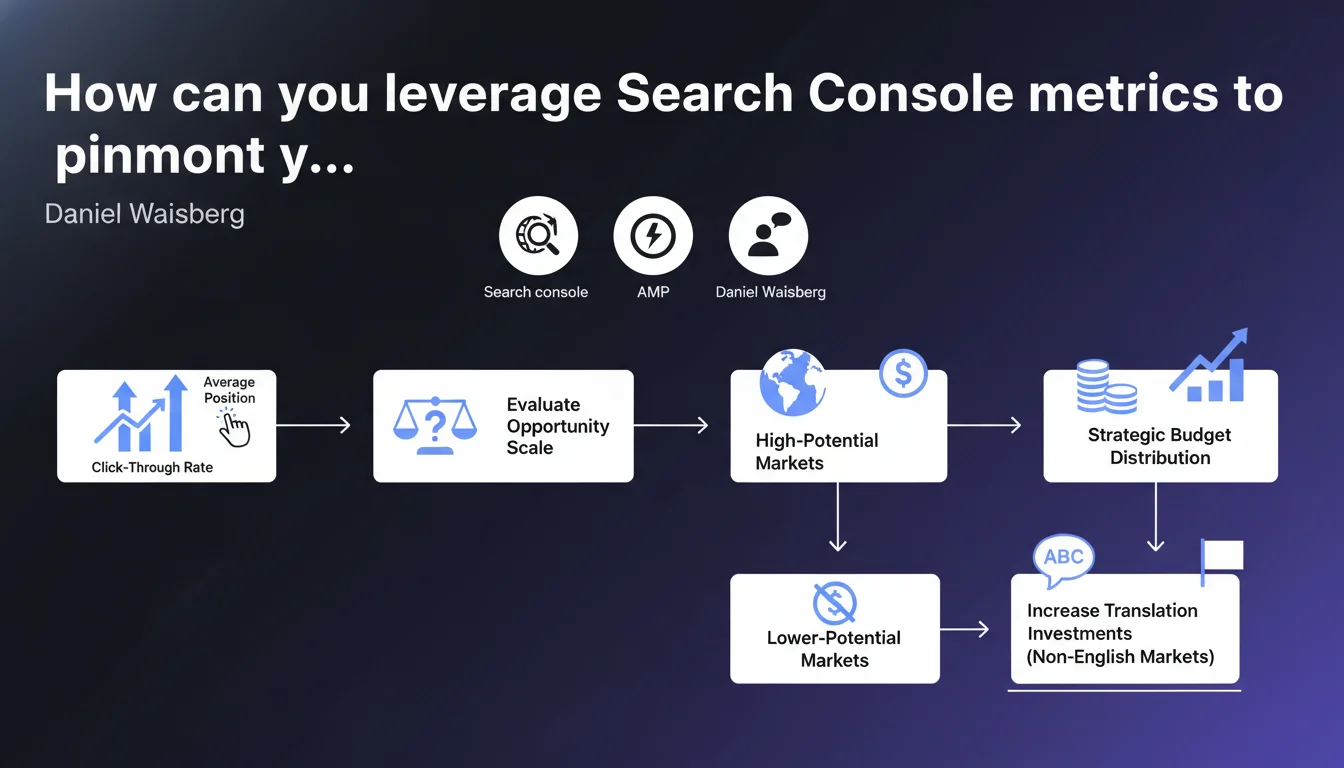
- □ Faut-il vraiment piloter son budget SEO par analyse géographique ?
Google confirms that average position and click-through rate in Search Console are reliable indicators for assessing the real potential of a geographic or linguistic market. These metrics enable you to prioritize budget allocation—particularly for translation investments—on areas where organic traffic opportunity is measurable rather than speculative.
What you need to understand
Why does Google emphasize these metrics over others?
Average position and CTR are direct behavioral metrics that reflect both your current visibility and user appetite for your content. Unlike estimated search volume—which is often inaccurate at the local level—this data comes from your actual performance.
Google is signaling here that these indicators allow you to objectify expansion decisions: rather than guessing which markets to invest in, you observe where your existing content is already generating engagement despite limited reach (e.g., partially translated pages, generic content).
What does a high CTR combined with a mediocre average position reveal?
This pattern indicates strong user appetite but unexploited visibility opportunity. Internet users are clicking on your results proportionally more than average, which signals either relevance or a lack of credible alternatives.
This is precisely the signal of an under-optimized market: if your CTR at position 8 exceeds a competitor's CTR at position 3, you have enormous room for improvement by simply enhancing semantic targeting and localized content depth.
How do these metrics translate into budget decisions?
The approach involves mapping your markets along two axes: current performance (position, CTR) and opportunity volume (impressions, related searches). A market with 10,000 monthly impressions, a 4% CTR at position 6, and an above-average conversion rate naturally becomes a priority.
Google thus encourages you to move away from a "we translate everything uniformly" mindset toward adopting differentiated allocation: invest heavily in markets where signals converge, test minimally in those where data is lacking.
- Average position measures your current ability to capture attention in a given market
- CTR reveals the fit between your value proposition and local expectations
- Combining these metrics with impressions and conversion rate allows you to objectively score each market
- Non-English-speaking markets often show higher CTRs because SEO competition is less mature there
- This approach prevents wasting translation budget on areas with low return potential
SEO Expert opinion
Is this statement consistent with practices observed in the field?
Yes, and it's actually one of the rare Google communications that perfectly aligns with empirical observations. International sites that segment investments based on these metrics systematically outperform those using a uniform strategy.
I've seen cases where a market representing 3% of total traffic generated 18% of revenue, with an organic CTR 2.5x higher than average. Ignoring these signals means leaving money on the table.
What nuances should be applied to this approach?
The main risk: confusing absence of data with absence of opportunity. A market where you currently have no visibility may have enormous potential, but your Search Console metrics will be empty or not statistically significant.
In this case, you must cross-reference with external data: local Google Trends, search volumes in Google Ads (even if approximate), competitive analysis via third-party tools. Google's statement remains valid for arbitrating between markets where you already have a presence, but it doesn't replace an exploration phase for untapped zones.
Another point: CTR is influenced by the local SERP landscape. If Google displays four ads, a local pack, and featured snippets, your organic CTR will be mechanically compressed. Comparing the CTR of a highly competitive market (e.g., UK) to that of an emerging market (e.g., Romania) without weighting these biases can skew your decision-making.
In which cases does this rule not fully apply?
For niche B2B markets, impression volumes may be too low to establish statistically robust trends. Is a market with 200 monthly impressions and 8% CTR more promising than one with 5,000 impressions and 2.5% CTR? The answer depends on average order value and sales cycle, not solely on SEO metrics.
Similarly, sites whose model relies on branded traffic (e.g., retailers with strong local brand awareness) will see biased metrics: CTR will be artificially high on branded queries, masking weakness on generic queries. You must then segment data by query type before making decisions.
Practical impact and recommendations
What should you do concretely to apply this method?
First step: export Search Console data by country and language over at least 6 months to smooth seasonal variations. Segment by market, then calculate for each: average position, average CTR, total impressions, total clicks.
Next, cross-reference with your Analytics data: conversion rate, revenue per session, session duration. A market with high CTR but 80% bounce rate and zero conversions signals a post-click relevance problem, not an opportunity.
Build a simple scoring system: assign points based on position (the lower, the greater the progression potential if CTR is solid), CTR (above average = strong signal), impressions (opportunity volume), and conversion rate (traffic quality). Markets that accumulate 3 positive signals out of 4 deserve prioritized investment.
What errors should you avoid when analyzing these metrics?
Never compare CTRs without contextualizing position. A 3% CTR at position 1 is catastrophic; the same CTR at position 9 indicates strong appetite. Use CTR benchmarks by position—they vary by industry, but general ranges are well-established.
Also avoid over-optimizing for a single market at the expense of overall consistency. If you invest heavily in translation for Germany but your technical infrastructure (hreflang, load time, crawlability) remains flawed, you're wasting the investment. International SEO expansion requires a systemic approach, not a collection of isolated tactics.
Finally, don't overlook the hidden costs of localization: quality translation, cultural adaptation, content maintenance, local customer support. A market with strong SEO potential but high operational costs may have lower ROI than a more modest market that's easier to serve.
How can you verify that your expansion strategy is properly calibrated?
Establish monthly tracking by market: average position evolution (should improve after content investment), CTR evolution (should stabilize or increase slightly), organic traffic and conversion evolution. If after 3 months of sustained investment none of these indicators move, either your initial diagnosis was wrong or execution is flawed.
Also test micro-investments on markets with limited data: translate 10-15 strategic pages, optimize technically, observe metrics over 2 months. If signals are positive, scale up; if not, pivot. This "test and learn" approach limits risk while accelerating learning.
- Export Search Console data by country/language over 6+ months
- Calculate average position, CTR, impressions, and clicks per market
- Cross-reference with conversion rate and revenue per session (Analytics)
- Score each market based on current performance + progression potential
- Contextualize CTR based on position and local SERP structure
- Prioritize markets showing multiple positive signals (CTR + impressions + conversion)
- Avoid raw CTR comparisons without positional weighting
- Test on small scale in data-limited markets before major investment
- Track metric evolution monthly after investment
❓ Frequently Asked Questions
Peut-on utiliser ces métriques pour des marchés où on n'a encore aucune présence ?
Quel est le seuil minimum d'impressions pour que les métriques soient fiables ?
Comment pondérer le CTR en fonction de la structure de SERP locale ?
Faut-il privilégier un marché à fort CTR ou un marché à fort volume d'impressions ?
Ces métriques sont-elles pertinentes pour le e-commerce autant que pour le contenu éditorial ?
🎥 From the same video 6
Other SEO insights extracted from this same Google Search Central video · published on 28/02/2023
🎥 Watch the full video on YouTube →
💬 Comments (0)
Be the first to comment.