Official statement
Other statements from this video 6 ▾
- □ Pourquoi exporter vos données Search Console peut transformer votre stratégie SEO ?
- □ Comment exploiter pleinement les exports de données dans Search Console ?
- □ Pourquoi Google limite-t-il l'export Search Console à seulement 1000 lignes ?
- □ Comment analyser efficacement les performances SEO de chaque section de votre site ?
- □ Faut-il vraiment piloter son budget SEO par analyse géographique ?
- □ Comment utiliser les métriques Search Console pour identifier vos marchés à fort potentiel ?
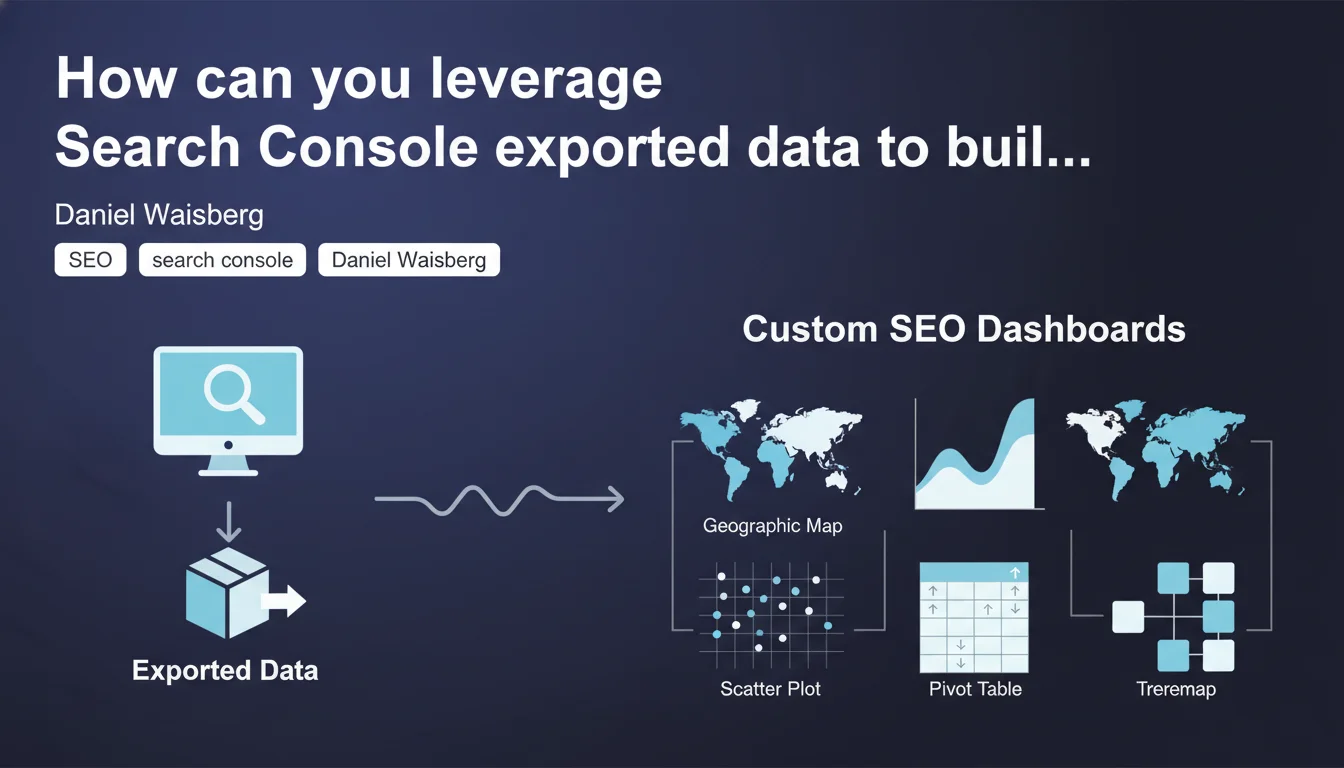
Google confirms that exported Search Console data can power visualizations unavailable natively: geographic maps, area charts, scatter plots, pivot tables, treemaps. Exporting unlocks advanced analysis capabilities that the standard interface doesn't offer.
What you need to understand
Why does Google explicitly mention these visualization formats?
Search Console offers standard charts — time series lines, comparative bars — but remains limited in its ability to cross multiple dimensions. Google acknowledges here that exporting raw data (via API or CSV) enables building personalized dashboards using third-party tools like Data Studio, Tableau, Power BI, or Python.
The list provided — geographic maps, area charts, scatter plots, pivot tables, treemaps — is no accident. It targets specific analytical use cases: geographic distribution of impressions, CTR/position correlations, multidimensional segmentation of pages.
What are the limitations of the native Search Console interface?
The standard interface enforces mutually exclusive filters and doesn't allow viewing multiple complex dimensions simultaneously. For example, it's impossible to generate a heatmap of queries by country and device with a single click.
Exporting bypasses these restrictions. You retrieve raw data and structure it however you want — custom aggregation, derived metric calculations, joins with other sources (Analytics, server logs, CRM).
What tools concretely leverage these exports?
Practitioners primarily use Google Data Studio (free, native API connector), Tableau or Power BI for larger organizations, and Python/R scripts for advanced statistical analysis. Some even aggregate Search Console + Analytics + third-party ranking data into a single unified dashboard.
- API or CSV export: both work, but API enables automation and data freshness
- Advanced visualizations: geographic maps, scatter plots (CTR vs position), treemaps (traffic distribution by category)
- Pivot tables: Excel/Sheets are sufficient to cross queries × pages × countries in a few clicks
- Native dashboard limitations: Google implicitly confirms they don't cover all analytical needs
SEO Expert opinion
Does this statement reveal a weakness in Search Console?
Yes, and Google doesn't hide it. If exporting to third-party tools is officially encouraged, it's because the native interface isn't enough for serious analysis. Search Console dashboards remain geared toward "basic monitoring," not "deep investigation."
Concretely? You can't easily cross "long-tail queries + CTR < 2% + position 5-10 + mobile + France" without exporting data. It's an admission: the internal tool remains deliberately constrained.
Are the cited visualizations really useful for SEO?
It depends on your analysis level. A CTR/position scatter plot helps identify underperforming queries (position 3 but CTR of a position 8 result). A treemap reveals which page categories generate 80% of traffic. A geographic map shows where your site loses visibility.
But let's be honest: many SEO professionals do just fine with the native interface. These advanced visualizations become essential on high-volume sites (e-commerce > 10K products, national media outlets, multilingual SaaS platforms). Below that threshold, it's nice-to-have.
Is Google pushing toward Data Studio to lock in its ecosystem?
Data Studio (now Looker Studio) benefits from a native Search Console API connector, which drastically simplifies integration. Coincidence? Unlikely. Google is making it easy to adopt its own BI tool while remaining open to third-party solutions.
The risk: becoming dependent on an end-to-end Google ecosystem (Search Console → Looker Studio → BigQuery). Nothing is forbidden, but it's worth considering if you value technological independence. [To verify]: no official data on adoption rates of Looker Studio vs Tableau among SEO professionals.
Practical impact and recommendations
What should you do concretely to leverage these exports?
First step: identify analytical needs not covered by the native interface. If you find yourself regularly copying Search Console data into Excel to perform calculations, that's a clear signal.
Next, choose your tool. To start: Looker Studio (free, gentle learning curve). For statistical analysis: Python + pandas + matplotlib. For corporate dashboards: Tableau or Power BI. The Search Console API is documented, and connectors exist for all these tools.
Which visualizations to prioritize based on your context?
If you manage an international e-commerce site: geographic map to compare visibility by country, treemap to identify underperforming product categories. If you oversee a national media outlet: area charts to track traffic evolution by section, scatter plots to detect articles with high potential (decent average position, low CTR).
For a local business site: the Search Console interface probably suffices. Don't over-complicate things for the sake of it — custom dashboards have non-negligible maintenance costs.
What mistakes should you avoid during setup?
Classic mistake: aggregating incompatible data. Search Console anonymizes low-volume queries — if you cross too many dimensions, you'll get data gaps. Respect privacy thresholds, or your visualizations will be biased.
Another trap: failing to automate refreshes. A dashboard displaying three-week-old data is useless. Configure ETL (Extract-Transform-Load) via API or native connectors to guarantee data freshness.
- Audit the analytical limitations of the native Search Console interface for your site
- Choose a visualization tool suited to your technical level and budget
- Configure API export (or CSV if volume is low) with OAuth authentication
- Test the visualizations Google mentions (geographic map, scatter plot, treemap) on a sample
- Automate data refresh to avoid outdated dashboards
- Document derived metric calculations (weighted average CTR, cannibalization rate, etc.)
- Train teams to interpret the new visualizations
❓ Frequently Asked Questions
Faut-il utiliser l'API ou l'export CSV pour alimenter un dashboard personnalisé ?
Quels outils de visualisation sont compatibles avec les données Search Console ?
Les visualisations avancées révèlent-elles des insights impossibles à détecter autrement ?
Y a-t-il des limites aux données exportées de Search Console ?
Un dashboard personnalisé remplace-t-il totalement l'interface Search Console ?
🎥 From the same video 6
Other SEO insights extracted from this same Google Search Central video · published on 28/02/2023
🎥 Watch the full video on YouTube →
💬 Comments (0)
Be the first to comment.