Official statement
Other statements from this video 6 ▾
- □ Pourquoi exporter vos données Search Console peut transformer votre stratégie SEO ?
- □ Comment exploiter pleinement les exports de données dans Search Console ?
- □ Pourquoi Google limite-t-il l'export Search Console à seulement 1000 lignes ?
- □ Comment exploiter les données exportées de Search Console pour créer des tableaux de bord SEO sur mesure ?
- □ Faut-il vraiment piloter son budget SEO par analyse géographique ?
- □ Comment utiliser les métriques Search Console pour identifier vos marchés à fort potentiel ?
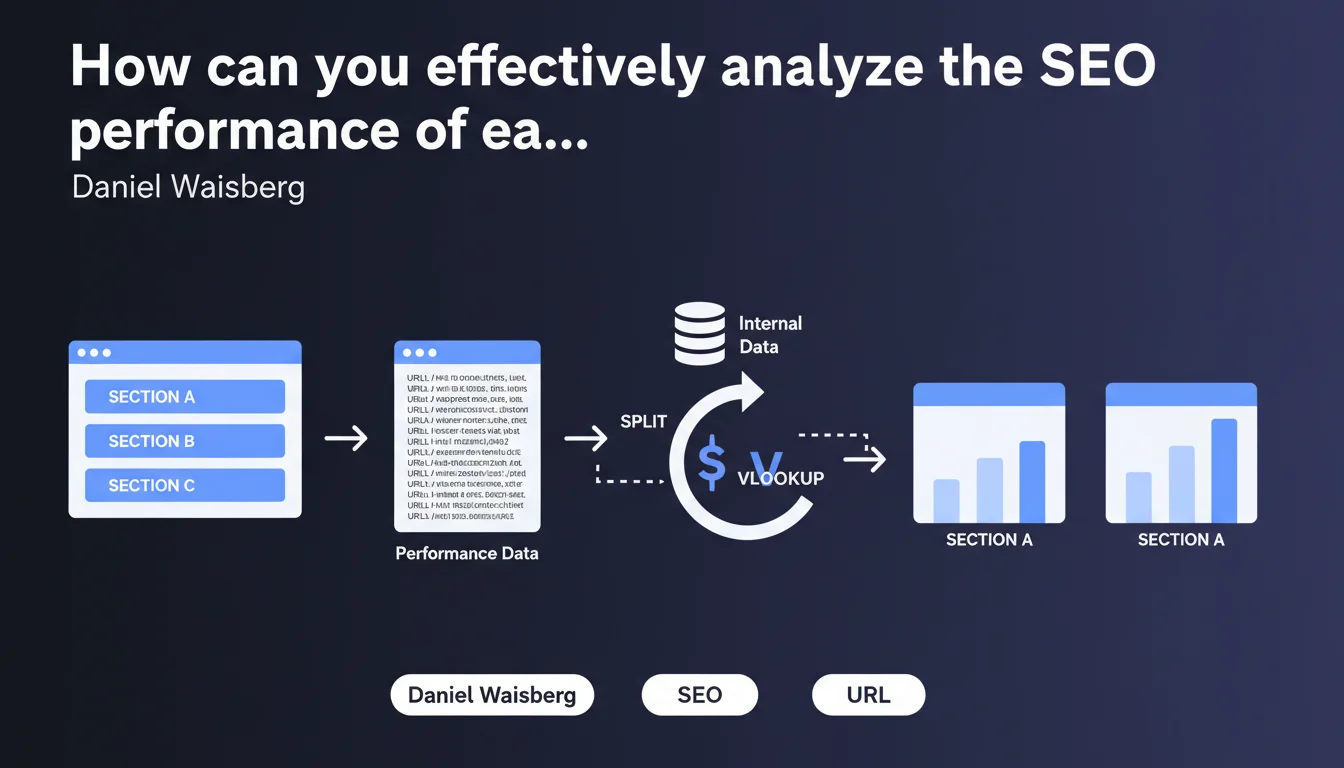
Google confirms that exporting Performance data from Search Console allows for detailed analysis of performance by site section or directory. Using spreadsheet functions like SPLIT and VLOOKUP, you can segment URLs and cross-reference this data with internal information to precisely identify which parts of your site are underperforming.
What you need to understand
Why should you segment your analysis by site sections?
Most structured sites — e-commerce, media outlets, SaaS platforms — organize their content into distinct sections (by categories, page types, geographic zones). Analyzing performance globally obscures the information: it's impossible to know whether it's the blog dragging down the stats or if product pages are stagnating.
Waisberg's statement points toward a simple but underutilized method: export raw data from Search Console and segment it intelligently. No need for expensive third-party tools for this first level of analysis — a spreadsheet is enough.
How does this method work in practice?
The principle relies on the SPLIT function which divides a URL into segments according to the "\/" separator. Example: "\/blog\/seo-technique\/" becomes ["blog", "seo-technique"]. This gives you the first directory, which often corresponds to a logical section of your site.
Next, VLOOKUP (or INDEX/MATCH) allows you to join this data with an internal reference: page typology, business priority level, responsible team, etc. You then get a dashboard that crosses SEO performance with business segmentation.
- Search Console export: raw data on clicks, impressions, CTR, position by URL
- SPLIT function: extraction of the main directory of each URL
- VLOOKUP function: enrichment with internal data (category, priority, etc.)
- Pivot tables: aggregation by section to compare performance
- Quick identification of underperforming sections or those with untapped potential
Does this approach replace classic SEO tools?
No. It complements them.
Tools like Semrush or Ahrefs excel at competitive analysis, precise position tracking, and keyword discovery. But for a cross-functional view aligned with your actual site structure and business priorities, nothing beats a custom export analyzed according to your own segmentation criteria.
SEO Expert opinion
Does this statement really bring anything new to the table?
Honestly? Not really. Any SEO professional who has ever opened a Search Console export knows you can manipulate it in a spreadsheet. What Waisberg is doing here is reminding everyone of a basic best practice that many neglect out of laziness or because they rely too much on third-party tool interfaces.
The real contribution is highlighting the idea of cross-referencing this data with internal information. There, you move beyond pure SEO analysis into business-driven logic: which sections deserve more editorial investment? Where should product teams concentrate their optimization efforts?
What limitations should you keep in mind?
First point: this method assumes your URL structure is clean and logical. If your URLs are chaotic, with parameters everywhere and directories that correspond to nothing, SPLIT won't save you. [Check this on your own site before you start.
Second limitation: the Search Console export caps at 1000 rows in the interface and requires the API to go beyond. For a large site, you need to script — and then you're no longer in Sunday-afternoon spreadsheet territory. The scalability of this manual approach has its limits.
In what cases is this method truly useful?
It shines on mid-sized sites with clear architecture: blogs structured by topic, e-commerce sites with well-defined categories, portals with distinct geographic or thematic zones. You have 10 to 50 sections to compare? That's the sweet spot.
On the other hand, for a pure-play SEO site with thousands of dynamically generated landing pages or a UGC content aggregator, this manual approach quickly becomes unmanageable. You then need to move to dedicated BI solutions (Looker Studio connected to BigQuery, for example) to automate all of this.
Practical impact and recommendations
What do you need to do concretely to implement this analysis?
Start by exporting your Search Console data over a significant period — at least 3 months to smooth out seasonal variations. In the interface, go to Performance > Pages, filter if needed, then click on the export icon (limited to 1000 rows). To go beyond, use the Search Console API or connectors like those from Looker Studio.
In your spreadsheet, create a column that extracts the first directory of each URL with a formula like =SPLIT(A2,"/") and then retrieve the segment you're interested in. Depending on your structure, this will be column B, C, or D of the result. Test on a few rows to validate the logic.
Next, prepare an internal mapping reference: a tab that lists each directory and associates it with metadata (section, business category, strategic priority, responsible team). Use VLOOKUP to join this information to your export. You get an enriched dataset ready to be pivoted.
- Export Search Console data (Pages) for 3+ months minimum
- Clean parasitic URLs (parameters, duplicates) before processing
- Use SPLIT to extract the main directory of each URL
- Create an internal mapping reference directory/metadata
- Join data with VLOOKUP or INDEX/MATCH
- Generate pivot tables by section (clicks, impressions, CTR, average position)
- Identify high-potential sections (high impressions, low CTR) and those in difficulty (position drops)
- Cross-reference with Analytics data to validate post-click engagement
What mistakes should you avoid in this process?
Don't get lost in unnecessary complexity. No need to break things down into 50 micro-segments if you don't have the resources to act on each one. Focus on 5 to 10 major sections that make sense for your business.
Another trap: blindly trusting the figures without looking at traffic quality. A section can have lots of impressions but a catastrophic bounce rate and zero conversions. Always cross-reference with Analytics or your CRM before concluding that an area is performing well.
Finally, beware of seasonal biases. If you compare December (peak e-commerce period) with February (slow period), your conclusions will be skewed. Always compare equivalent periods year over year, or smooth over several months.
How do you scale this analysis for the long term?
The manual approach works for a one-time diagnosis, but it quickly becomes time-consuming if you want monthly tracking. To automate, connect the Search Console API to Looker Studio or directly to BigQuery if you have the technical skills.
Create a recurring dashboard that updates automatically: performance by section, month-over-month evolution, alerts on sudden drops. Add annotations to provide context (migrations, campaigns, Google updates) and share it with the relevant business teams.
❓ Frequently Asked Questions
Peut-on utiliser cette méthode sur un site sans structure en répertoires ?
Quelle est la différence entre cette approche et les filtres natifs de la Search Console ?
Faut-il utiliser l'API Search Console ou l'export manuel suffit ?
Cette méthode fonctionne-t-elle aussi pour analyser les performances par type de contenu ?
Peut-on détecter des problèmes de cannibalisation avec cette approche ?
🎥 From the same video 6
Other SEO insights extracted from this same Google Search Central video · published on 28/02/2023
🎥 Watch the full video on YouTube →
💬 Comments (0)
Be the first to comment.