Official statement
Other statements from this video 8 ▾
- □ Les Core Web Vitals sont-ils vraiment un outil de diagnostic UX ou juste un critère de ranking ?
- □ Pourquoi Google insiste-t-il sur les données utilisateurs réels pour mesurer la performance SEO ?
- □ Pourquoi Google privilégie-t-il les données lab pour le débogage SEO ?
- □ Lighthouse est-il vraiment l'outil de référence pour diagnostiquer les problèmes de performance ?
- □ Pourquoi Lighthouse ne détecte-t-il pas tous vos problèmes de Core Web Vitals ?
- □ Pourquoi le performance panel Chrome DevTools change-t-il la donne pour le debug des Core Web Vitals ?
- □ Les données de laboratoire peuvent-elles remplacer les données terrain pour optimiser l'UX ?
- □ Faut-il vraiment tester les Core Web Vitals en laboratoire plutôt qu'en production ?
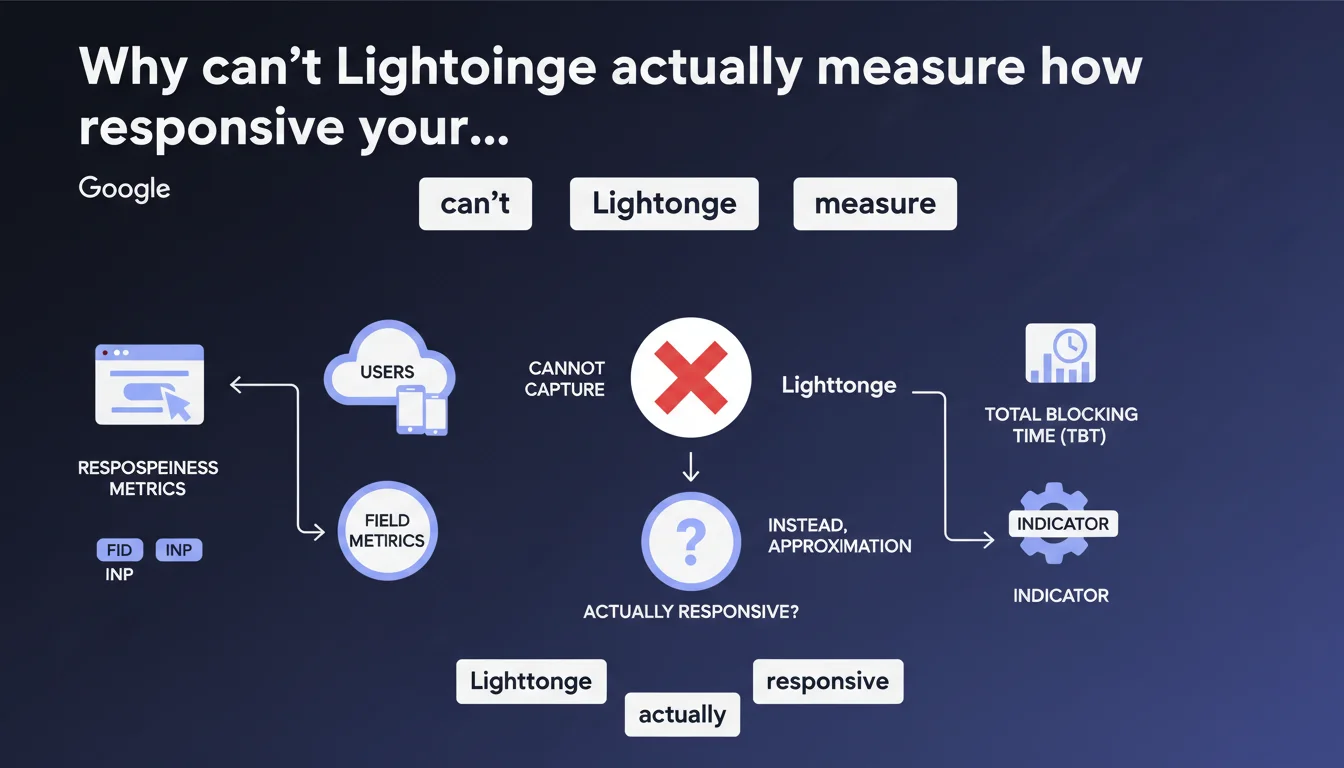
Google reminds us that FID and INP are field metrics that cannot be accurately captured by Lighthouse. The tool uses Total Blocking Time as an approximation, which means a good Lighthouse score doesn't guarantee a satisfying real user experience. CrUX data remains the only reliable reference for evaluating responsiveness as perceived by your actual visitors.
What you need to understand
What's the fundamental difference between field metrics and lab metrics?
Field metrics capture the real experience of actual users on varied devices, diverse connections, with unpredictable behaviors. FID (First Input Delay) measures the delay before the first interaction, INP (Interaction to Next Paint) evaluates overall responsiveness throughout the entire session.
Lighthouse, on the other hand, runs in a controlled and reproducible environment. It's impossible to simulate a real user click at the right moment, on the right element, with the exact CPU load of a mid-range smartphone running Chrome with 12 tabs open. Lab gives you a trend — field gives you the truth.
Why does Google use Total Blocking Time as a proxy?
TBT (Total Blocking Time) measures the cumulative time during which the main thread is blocked between FCP and TTI. It's an indicator available in a lab environment, statistically correlated with FID and INP — but it's an approximation, not an equivalence.
A site with high TBT will likely have field INP issues. But the reverse isn't guaranteed: you can show correct TBT in lab and suffer massive blocking in production because a third-party script loads differently depending on the user context.
Which data should you prioritize monitoring?
- CrUX (Chrome User Experience Report): the only field data source validated by Google for ranking
- RUM (Real User Monitoring): your own field metrics via Analytics or dedicated solutions
- Lighthouse/PageSpeed Insights: diagnostic indicators to identify optimization opportunities, never absolute truth
- Search Console: Core Web Vitals report based on CrUX, with 75th percentile distribution
SEO Expert opinion
Is this lab/field distinction really new?
No — and that's precisely what stands out. Google has been hammering this message home since Core Web Vitals launched in 2020. If this clarification is resurfacing now, it's likely because too many practitioners are still optimizing solely for Lighthouse.
The classic trap: a site displays 95/100 on PageSpeed Insights, the client is thrilled, but Search Console reports 60% of URLs with poor INP. Lighthouse scoring creates false confidence — it measures a single moment in ideal conditions that never reflect real-world complexity.
Is TBT really a good indicator?
Let's be honest: it's better than nothing, but far from sufficient. TBT captures blocking during initial load. INP, meanwhile, monitors the entire user experience, including post-load interactions — scrolling, button clicks, menu openings.
A typical case where TBT deceives you: an e-commerce site with aggressive lazy loading. Lighthouse sees clean initial load, low TBT. But as soon as the user scrolls, a flood of scripts executes, images load, trackers fire — and INP explodes. [Verify] this divergence against your own CrUX data if you notice it.
Should you ignore Lighthouse altogether?
Absolutely not. Lighthouse remains a valuable diagnostic tool for identifying quick wins: blocking JavaScript, unoptimized images, poorly loaded web fonts. But it should never be your sole reference.
Practical impact and recommendations
What specifically should you monitor every week?
Forget the reflex of "let me run Lighthouse". Log into Search Console, Core Web Vitals section. Look at INP distribution on mobile (that's where it matters). If more than 25% of your URLs are red, you have a potential ranking problem.
Complement with PageSpeed Insights in "Discover what your real users are experiencing" mode — it displays CrUX data for your origin. Compare with lab results to identify gaps. A massive gap signals your production environment differs significantly from test conditions.
How do you diagnose degraded INP in production?
Lighthouse TBT gives you an initial lead, but you need to dig deeper. Install a RUM (Real User Monitoring) solution — Google's web-vitals.js is free and integrates in 10 minutes. You'll see which specific interactions are problematic, on which devices, at what times.
Analyze long tasks with DevTools Performance under realistic conditions: 4x CPU throttling, slow 3G connection, mobile mode. Trace event handlers blocking the main thread for over 50ms. That's where 80% of INP issues hide.
What priority actions should you implement?
- Shift from "Lighthouse score" optimization to "field CrUX data" optimization
- Monitor INP with RUM or web-vitals.js on all key pages
- Fragment JavaScript: code splitting, lazy loading of non-critical modules
- Defer non-essential third-party scripts from initial load (analytics, chat, social widgets)
- Use Web Workers to offload heavy computations off the main thread
- Test under real conditions: actual devices, actual connections, actual user scenarios
- Audit event listeners: debounce, throttle, passive listeners where appropriate
The gap between lab and field performance often reveals invisible technical debt: legacy scripts, unoptimized dependencies, poorly architected front-end. These projects require sharp performance web expertise — identifying bottlenecks, prioritizing interventions, measuring real impact without breaking existing functionality.
If your team lacks resources or specific skills in these areas, engaging an SEO agency specialized in technical optimization can significantly accelerate your results while avoiding costly missteps.
❓ Frequently Asked Questions
Le score Lighthouse a-t-il encore une utilité pour le SEO ?
Quelle métrique remplace le FID dans les Core Web Vitals ?
Comment obtenir des données CrUX si mon site a peu de trafic ?
Un bon TBT garantit-il un bon INP en production ?
Faut-il optimiser pour mobile ou desktop en priorité ?
🎥 From the same video 8
Other SEO insights extracted from this same Google Search Central video · published on 29/08/2023
🎥 Watch the full video on YouTube →
💬 Comments (0)
Be the first to comment.