Official statement
Other statements from this video 8 ▾
- □ Les Core Web Vitals sont-ils vraiment un outil de diagnostic UX ou juste un critère de ranking ?
- □ Pourquoi Google insiste-t-il sur les données utilisateurs réels pour mesurer la performance SEO ?
- □ Pourquoi Google privilégie-t-il les données lab pour le débogage SEO ?
- □ Lighthouse est-il vraiment l'outil de référence pour diagnostiquer les problèmes de performance ?
- □ Pourquoi Lighthouse ne peut-il pas mesurer la vraie réactivité de votre site ?
- □ Pourquoi Lighthouse ne détecte-t-il pas tous vos problèmes de Core Web Vitals ?
- □ Les données de laboratoire peuvent-elles remplacer les données terrain pour optimiser l'UX ?
- □ Faut-il vraiment tester les Core Web Vitals en laboratoire plutôt qu'en production ?
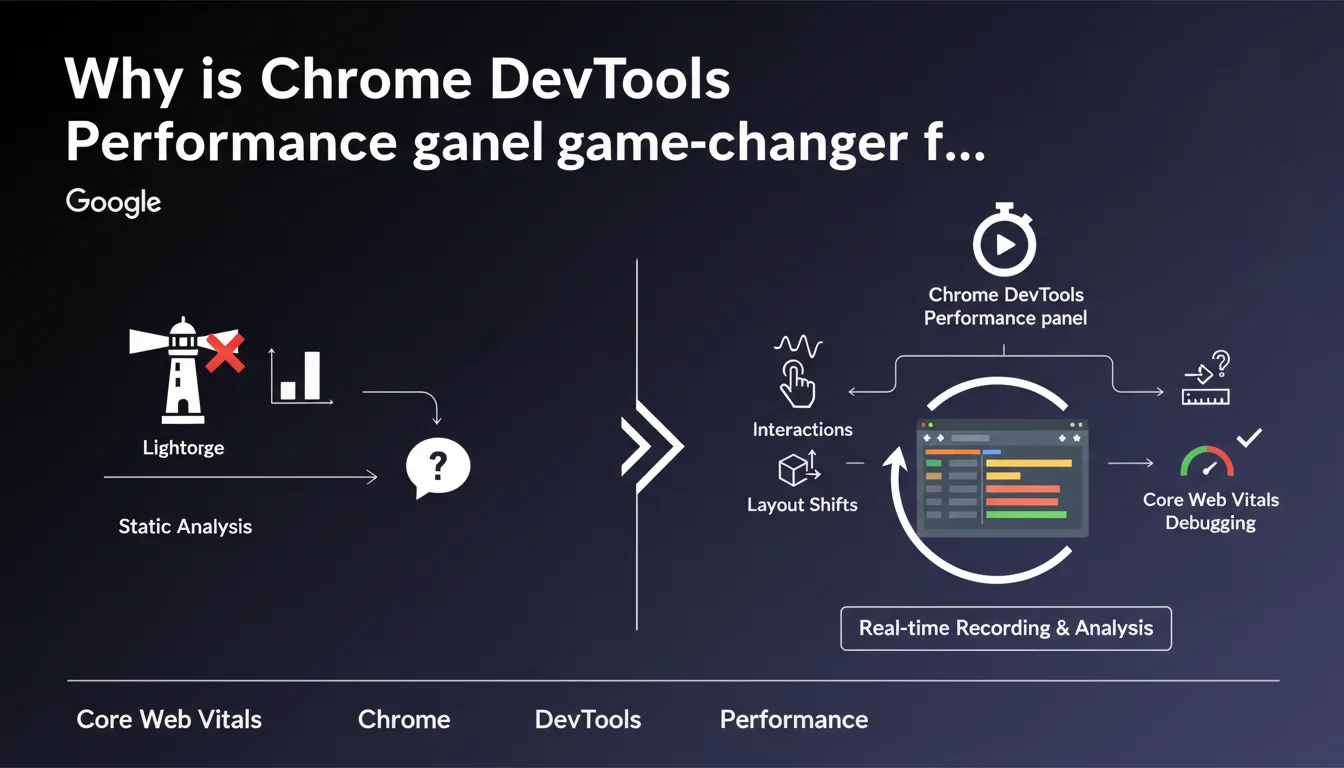
Google emphasizes that Chrome DevTools' performance panel allows you to record real interactions with a page, unlike Lighthouse which only measures initial loading. This tool more easily detects responsiveness issues (INP) and layout shifts (CLS) that occur after user interaction. For SEOs, it's the best way to identify performance slowdowns that invisible in standard audits.
What you need to understand
What is Lighthouse's limitation for diagnosing performance issues?
Lighthouse analyzes the page in a static state, at the moment of loading. It simulates a controlled environment and produces a score based on initial metrics like LCP or CLS at load.
The problem? The majority of responsiveness issues and visual shifts occur during user interaction. A menu opening, a form submitting, a button click — all critical moments that Lighthouse doesn't capture. Result: a site can display a good Lighthouse score while delivering a catastrophic user experience.
How does the performance panel complement Lighthouse?
The performance panel records what happens while you interact with the page. You click, you scroll, you navigate — and the tool captures every frame, every blocking script, every layout recalculation.
Concretely? You identify long JavaScript tasks that delay response to click (INP), DOM changes that cause late visual shifts (post-load CLS), or successive reflows that degrade smoothness. This is debugging under real conditions, not in a sterile lab.
Why is this distinction critical for SEO in 2024 and beyond?
Because INP is now a Core Web Vital, and it precisely measures responsiveness to interactions. CLS, meanwhile, is no longer evaluated only at load — shifts during the session also count toward the CrUX score.
A Lighthouse audit alone is no longer sufficient. If your field data (CrUX) shows poor INP while Lighthouse is green, the problem lies in post-load interactions. The performance panel then becomes the reference tool for tracking these anomalies.
- Lighthouse = load snapshot, controlled lab environment
- Performance panel = recording of real interactions, dynamic context
- INP and post-load CLS require interaction analysis, not just first paint
- CrUX data reflects real usage — if it diverges from your audits, you're missing interaction issues
SEO Expert opinion
Is this recommendation consistent with what we observe in the field?
Yes, and it's even a point rarely highlighted by Google with such clarity. Many sites have respectable Lighthouse scores (80-90 in performance) while displaying catastrophic INP in CrUX (beyond 500 ms).
Why? Poorly optimized JS frameworks, poorly delegated event listeners, style recalculations triggered on every interaction. Lighthouse misses all of that. The performance panel, on the other hand, exposes the culprits: long tasks, forced reflows, third-party scripts blocking at click time.
What are the limitations of this tool for comprehensive SEO diagnostics?
The performance panel remains a developer tool first and foremost. It requires a fine understanding of browser mechanics, JavaScript call stacks, and request waterfalls. For an SEO who doesn't code daily, the learning curve is steep.
Another limitation: manual recording. You must anticipate problematic interactions — clicking on a certain button, scrolling to a certain place. If you don't know where to look, you risk missing the real issue. CrUX data, on the other hand, aggregates real experience from thousands of users, providing a much more reliable overview. [To verify]: Google doesn't specify whether specific interaction patterns are more monitored than others in INP ranking calculation.
In what cases does this tool become indispensable?
When your field metrics (CrUX) diverge significantly from your lab audits, that's when to pull out the performance panel. Typically: an e-commerce site with dynamic filters, a SaaS with interactive dashboards, or any site relying on heavy client-side rendering.
Let's be honest — if your site is a static HTML blog, Lighthouse is more than enough. But as soon as there's JavaScript manipulating the DOM in response to user actions, the performance panel becomes your best ally to understand why the real experience is poor while lab tests are green.
Practical impact and recommendations
How to concretely use the performance panel to improve INP?
Open Chrome DevTools, Performance tab. Click the record button, then interact with your page as a user would: click a button, open a menu, submit a form. Stop recording.
Analyze the timeline. Look for Long Tasks (tasks longer than 50 ms) that occur between click and visual response. Identify responsible scripts — often overloaded event handlers, unnecessary style recalculations, or unoptimized JavaScript animations. Isolate, optimize, test again.
What mistakes must you absolutely avoid when diagnosing?
Don't settle for recording just the initial load. That's the classic mistake: you launch the profiler, the page loads, you stop. You've only captured what Lighthouse already measures.
The real gain is recording after loading, during user interactions. Second trap: recording for too long. A 30-second recording with dozens of interactions becomes unreadable. Target one problematic interaction at a time, record 3-5 seconds, analyze, iterate.
How to verify that optimizations actually work?
After fixing, compare before/after recordings. Key metric: the time between the input event and the next frame paint. If you've gone from 400 ms to 150 ms, you've gained. But the real judge remains CrUX after a few weeks of real data.
Also test on actual mobile devices (via Remote Debugging), not just desktop simulation mode. INP on mobile is often much worse than in simulation, especially on mid-range devices with limited CPU.
- Record post-load interactions, not just initial load
- Target one interaction at a time to keep the timeline readable
- Identify Long Tasks between input and paint — these are INP culprits
- Optimize event listeners: delegation, debouncing, remove forced style recalculations
- Test on real mobile devices, not in simulation — the performance gap can be brutal
- Validate corrections with CrUX data after a few weeks
❓ Frequently Asked Questions
Le performance panel peut-il remplacer totalement Lighthouse pour l'audit SEO ?
Est-ce que PageSpeed Insights utilise les données du performance panel ?
Faut-il analyser toutes les interactions possibles sur un site ?
Le performance panel fonctionne-t-il sur mobile ?
Comment savoir quelle interaction provoque un mauvais INP dans CrUX ?
🎥 From the same video 8
Other SEO insights extracted from this same Google Search Central video · published on 29/08/2023
🎥 Watch the full video on YouTube →
💬 Comments (0)
Be the first to comment.