
Official statement
Other statements from this video 10 ▾
- □ Is CLS really a full-fledged Google ranking factor you can't ignore?
- □ Are your images sabotaging your CLS without you even knowing it?
- □ Does specifying image dimensions really fix Cumulative Layout Shift?
- □ Are lab data really enough to optimize your Core Web Vitals, or do you need real user metrics?
- □ Does LCP really measure how fast your main content appears on screen?
- □ Should you really prioritize loading your hero images to improve LCP?
- □ Is lazy loading really hurting your above-the-fold images and LCP?
- □ Why is PageSpeed Insights the performance tool you should prioritize for SEO?
- □ Can HTTP/2 really boost your site's performance without major technical overhaul?
- □ Should you really convert all your images to WebP for SEO?
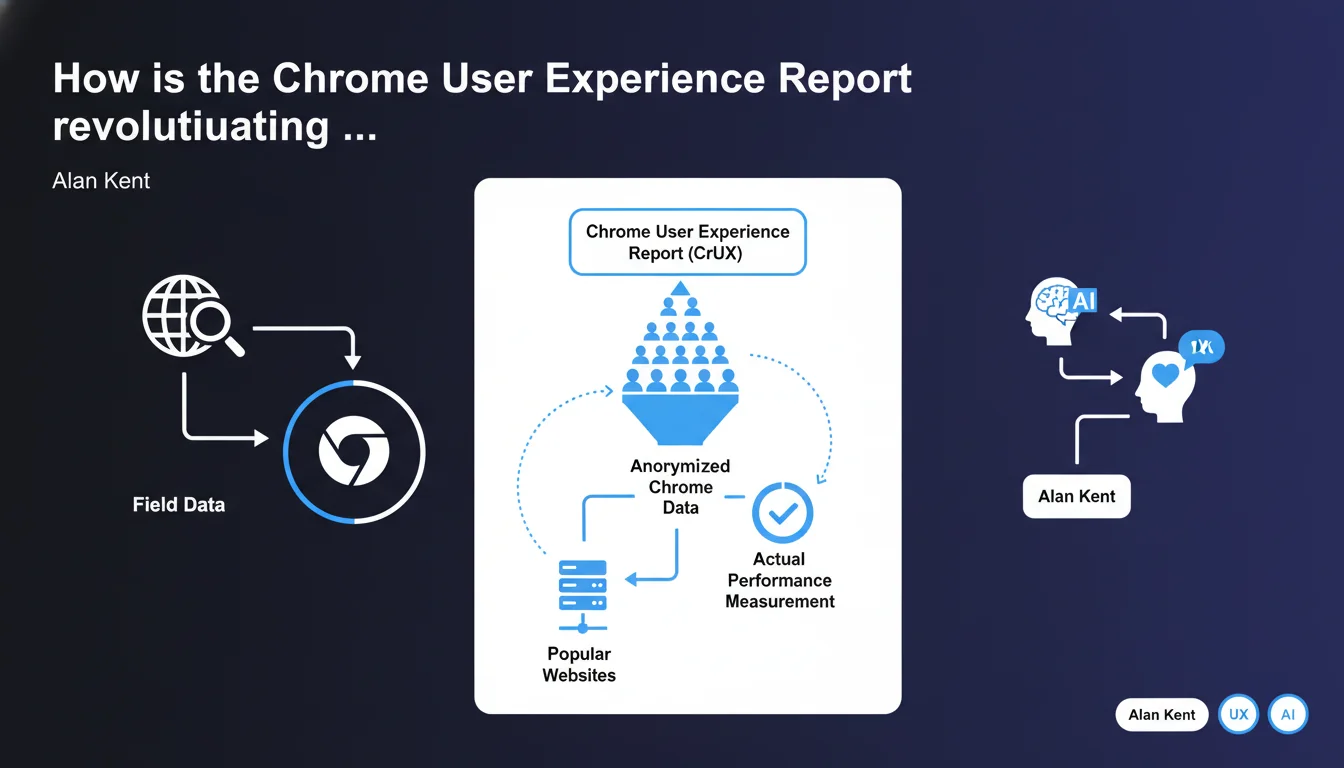
Google provides anonymized Chrome data through CrUX on the real-world performance of popular websites. These field data enable SEOs to analyze the user experience actually lived by real visitors, beyond synthetic lab testing.
What you need to understand
What is the Chrome User Experience Report and where does this data come from?
The Chrome User Experience Report (CrUX) collects anonymized data directly from the Chrome browser when users navigate websites. Unlike synthetic testing tools that simulate loading under controlled conditions, CrUX captures what your visitors actually experience — their connection, their device, their geographic location.
This data is made public by Google and accessible through multiple interfaces: BigQuery, the CrUX API, PageSpeed Insights, or the CrUX report in Search Console. But be careful — only popular websites with sufficient Chrome traffic volume appear in CrUX.
Why talk about "field data" rather than synthetic data?
Field data reflects the real user experience, with all its variations: unstable 4G in rural regions, entry-level smartphones, throttled enterprise networks. This is what your visitors experience daily.
Synthetic data, on the other hand, comes from tools like Lighthouse that test your site in a controlled environment — stable connection, standardized machine. Useful for diagnosis, but less representative of real-world conditions.
Which websites can access CrUX data and which ones are excluded?
Google filters the sites included in CrUX based on a minimum traffic threshold. If your website receives few visitors using Chrome, it won't appear in the public dataset. This is a significant limitation for small sites or niche B2B websites.
Large e-commerce sites, media outlets, and popular SaaS products typically have access to this data. Corporate websites with a few hundred visitors per month — probably not.
- CrUX provides real Chrome user data, not simulations
- Only sites with sufficient traffic volume appear in the dataset
- This data powers the Core Web Vitals used as a ranking signal
- Accessible via BigQuery, CrUX API, PageSpeed Insights, Search Console
- Metrics include LCP, FID, CLS, TTFB, FCP and other performance indicators
SEO Expert opinion
Does this statement really reveal something new?
Let's be honest: no. Alan Kent is reminding us here of a fundamental principle every SEO should already know since the Core Web Vitals rollout. CrUX is the source of truth for Google when evaluating a site's user experience. Your Lighthouse score isn't what matters for ranking — it's what real Chrome users report.
The interesting point remains the explicit mention of "popular websites". Google doesn't collect CrUX data for all sites. If you manage a niche site with 500 visitors per month, you may never have access to these field metrics. [To verify]: the exact threshold isn't publicly documented, and Google remains vague about what qualifies a site as "popular".
Can you really trust CrUX data as the only reference point?
CrUX data has its limitations. It only captures Chrome users who haven't disabled usage statistics sharing. This excludes part of your audience — particularly privacy-conscious users, those on Firefox, Safari, etc.
On mobile, the situation becomes more complex. iOS users default to Safari, and even if they install Chrome, the underlying engine remains WebKit. CrUX data is therefore skewed toward Android and desktop Chrome. For a site with 70% iOS traffic, CrUX only tells part of the story.
What are the gray areas Google doesn't mention here?
First, the temporal granularity. CrUX aggregates data over 28-day rolling windows. If you deploy an optimization today, you won't see the full impact for several weeks. Impossible to run rapid A/B testing with CrUX.
Second, the geographic representativeness. CrUX can show acceptable global performance while masking critical issues in certain regions. A site can display an acceptable median LCP in France but catastrophic performance in Southeast Asia — and these nuances disappear in the aggregates.
Practical impact and recommendations
How do you concretely access CrUX data for your site?
Several interfaces are available to you. The simplest: PageSpeed Insights. Enter a URL, and you'll immediately see if field CrUX data exists for that page or for the entire origin. Convenient for a quick diagnosis, but limited to one URL at a time.
For more detailed analysis, log into Google Search Console. The "Core Web Vitals" report aggregates CrUX data by URL groups. You can identify which sections of your site are problematic — product pages, categories, articles.
Experts will prefer BigQuery or the CrUX API. BigQuery provides access to complete history and enables custom queries — segmentation by country, connection type, device. The CrUX API offers programmatic access to integrate this data into your internal dashboards.
What if your site doesn't appear in CrUX?
First thing: verify you have sufficient Chrome traffic volume. If your audience is too small or heavily uses Safari/Firefox, CrUX will remain empty. In that case, continue monitoring your performance with synthetic tools (Lighthouse, WebPageTest) and Real User Monitoring (RUM) via third-party solutions.
Second option: focus on high-traffic pages. Even if your overall site doesn't reach the threshold, some popular pages may generate URL-level CrUX data. Prioritize optimizing these pages — they have more impact on your ranking anyway.
What mistakes should you avoid when interpreting CrUX data?
Don't compare your Lighthouse scores with your CrUX metrics. Lighthouse tests in ideal conditions; CrUX reflects real-world reality. A Lighthouse score of 95 with a CrUX LCP of 4 seconds signals a real performance issue — and it's CrUX that matters to Google.
Also avoid over-optimizing for the 75th percentile. Yes, Google judges your Core Web Vitals on this threshold, but neglecting the remaining 25% of users degrades their experience. Instead, aim for overall distribution improvement.
- Regularly check PageSpeed Insights and Search Console to monitor your CrUX data
- If your site doesn't appear in CrUX, implement a third-party RUM solution to capture your own field data
- Analyze CrUX data by geographic segment and device type via BigQuery to identify weak points
- Don't rely solely on Lighthouse — prioritize CrUX field metrics for your optimization decisions
- Anticipate the 28-day lag to see the impact of your optimizations in CrUX
- Compare your CrUX performance with that of your direct competitors to contextualize your results
❓ Frequently Asked Questions
Les données CrUX sont-elles disponibles pour tous les sites web ?
Quelle est la différence entre les données CrUX et les résultats Lighthouse ?
Combien de temps faut-il pour voir l'impact d'une optimisation dans CrUX ?
Les données CrUX incluent-elles le trafic Safari et Firefox ?
Peut-on accéder aux données CrUX au niveau d'une page spécifique ?
🎥 From the same video 10
Other SEO insights extracted from this same Google Search Central video · published on 06/05/2022
🎥 Watch the full video on YouTube →
💬 Comments (0)
Be the first to comment.