Official statement
Other statements from this video 8 ▾
- □ La vitesse de page est-elle vraiment un facteur de classement déterminant ?
- □ Les images sont-elles vraiment le principal frein aux performances de votre site ?
- □ Faut-il vraiment migrer toutes vos images vers WebP pour améliorer votre SEO ?
- □ L'attribut srcset sur les images est-il vraiment pris en compte par Google pour le SEO ?
- □ Les scripts tiers sabotent-ils réellement vos Core Web Vitals même quand ils ne s'affichent pas ?
- □ Le lazy loading est-il vraiment sans risque pour le référencement naturel ?
- □ L'attribut loading=lazy suffit-il vraiment pour optimiser le chargement des images en SEO ?
- □ Faut-il vraiment précharger les vidéos avec une image d'affiche pour le SEO ?
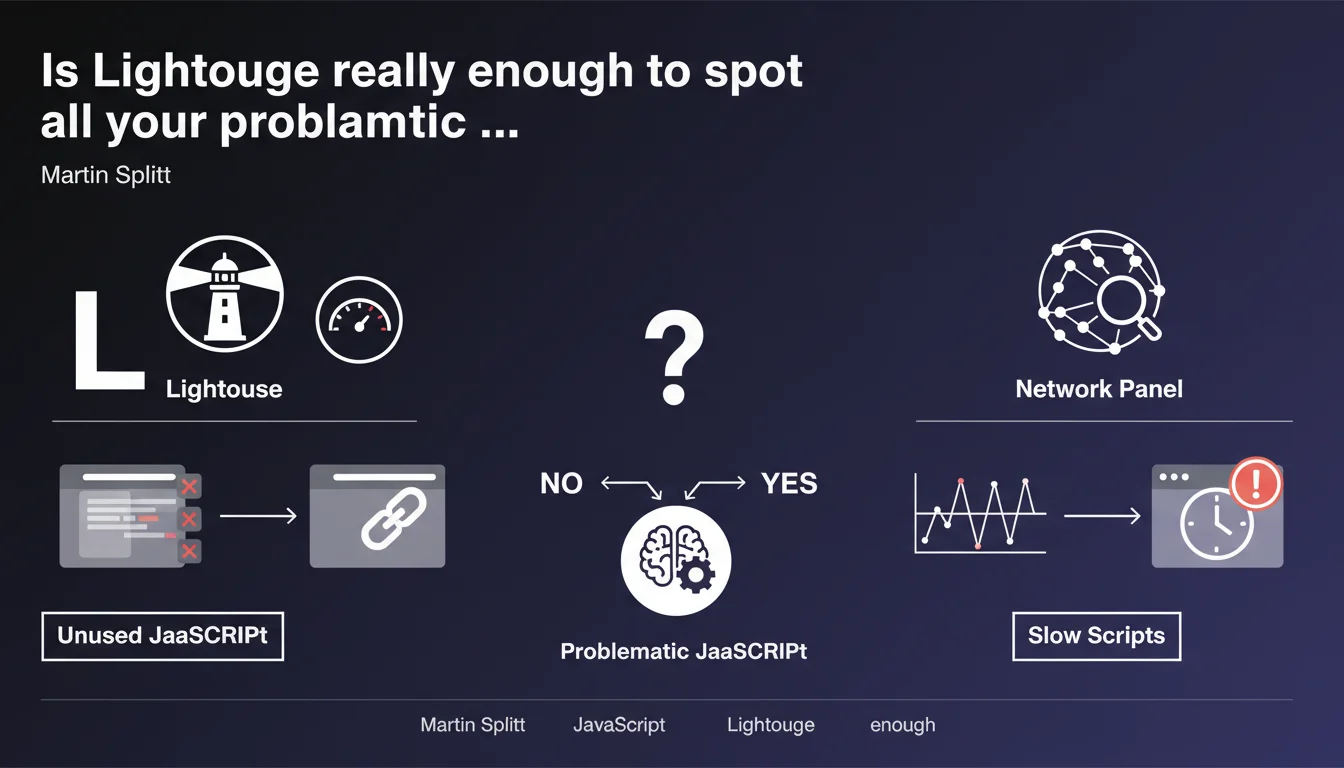
Martin Splitt recommends two tools to identify problematic JavaScript: Lighthouse to spot unused code, and the Network panel in DevTools to track slow scripts. The approach combines automated auditing and manual performance analysis, but remains deliberately vague about critical thresholds to respect.
What you need to understand
Google proposes a two-step methodology to audit JavaScript: a first pass with Lighthouse to detect dead code, a second with the Network panel in DevTools to analyze loading times.
This statement is part of ongoing recommendations on Core Web Vitals, where poorly optimized JavaScript directly impacts LCP and FID. But concretely, what does "too slow" or "unused" mean in this context?
What exactly does Lighthouse detect as unused JavaScript?
Lighthouse identifies code that is downloaded but not executed during the initial page load. Caution: just because a script isn't executed immediately doesn't mean it's useless — it may be necessary for later user interaction.
The audit is based on code coverage (Coverage) during the first few seconds. A 200 KB script where only 30 KB is used during loading will be flagged as problematic, even if the remaining 170 KB serves a purpose after a user click.
How does the Network panel help identify slow scripts?
The Network panel allows you to analyze the loading cascade and download time of each resource. You visualize scripts that block rendering, those that arrive too late, and dependencies that chain together.
Problem: Martin Splitt provides no numerical threshold. At what number of milliseconds does a script become "too slow"? 500 ms? 1 second? 3 seconds? This absence of concrete reference makes arbitration difficult.
Why does Google specifically recommend these two tools?
Lighthouse and DevTools are Google's own tools, built into Chrome and freely accessible. Their massive adoption ensures that developers speak the same language as PageSpeed Insights audits.
But let's be honest: these tools don't catch everything. They don't capture scripts loaded after user interaction, nor resources triggered by complex events. The audit remains partial.
- Lighthouse spots code downloaded but not executed during initial load
- The Network panel visualizes download times and rendering blocks
- No official threshold to qualify a script as "too slow"
- These tools don't capture scripts loaded after user interactions
- The approach combines automated audit and manual analysis
SEO Expert opinion
Is this recommendation really sufficient for a complete JavaScript audit?
No. Lighthouse and Network give you a snapshot at a specific moment, that of initial loading under controlled conditions. On a complex SPA or an e-commerce site with dozens of third-party scripts, this approach only reveals a fraction of the problem.
Scripts loaded in lazy loading, those triggered by scroll or click, trackers that activate after 5 seconds — all of that escapes standard Lighthouse auditing. And that's often where the real performance drains hide.
What does "unused JavaScript" concretely mean in the SEO context?
Google talks about "unused" code, but unused for whom? For Googlebot crawling the page, or for the user who might click a button? The distinction is crucial. A contact form script is never executed during crawl, yet it's essential.
The real issue: identifying JavaScript that blocks critical rendering without providing immediate value. Libraries loaded in full when only 5% is used. Polyfills for browsers that no longer exist. [To verify]: Google never specifies at what point a script transitions from "non-critical" to "problematic" for ranking.
Do performance thresholds vary by site type?
Absolutely, and that's where Martin Splitt's recommendation shows its limits. A WordPress blog with 3 scripts can afford to be less optimized than a marketplace with 40 third-party vendors. But Google doesn't differentiate in its guidelines.
In the field, we observe that e-commerce sites with poor Core Web Vitals still rank if they check all the other boxes (content, backlinks, authority). "Too slow" JavaScript seems less penalizing than claimed — or perhaps the tolerance threshold is higher than expected.
Practical impact and recommendations
How do I efficiently audit my site's JavaScript?
Start with a Lighthouse audit from Chrome DevTools (F12 > Lighthouse > Analyze page load). Check "Performance" and "Best Practices". The report will give you an initial list of scripts with their usage rate.
Next, open the Coverage panel (F12 > cmd/ctrl + Shift + P > "Show Coverage"). Load your page and trigger a few interactions. You'll see in real time what percentage of each JS file is actually executed.
What concrete actions should I take after the audit?
Prioritize scripts that are heavy and less than 50% used. Consider code splitting: break large bundles into chunks loaded on demand. For third-party libraries, check if lighter versions or alternatives exist.
For slow scripts identified in Network: verify if they block rendering (render-blocking). If yes, add defer or async attributes. If a third-party script slows everything down, load it after critical elements or consider replacing it.
What errors should I avoid when optimizing JavaScript?
Never remove a script without understanding its role. Some only execute after user interaction but remain essential. Test each modification on a staging environment with multiple user scenarios.
Avoid focusing solely on the Lighthouse score. A score of 100 that breaks half your site's functionality has no value. The goal: find the balance between performance and user experience.
- Audit with Lighthouse and enable the Coverage panel in DevTools
- Identify scripts with less than 50% of code executed at load
- Consider code splitting for large JavaScript bundles
- Verify defer/async attributes on render-blocking scripts
- Test all modifications in staging before production
- Monitor actual impact on Core Web Vitals via Search Console
- Document each third-party script and its purpose to facilitate decisions
❓ Frequently Asked Questions
Lighthouse détecte-t-il le JavaScript chargé après interaction utilisateur ?
À partir de quel pourcentage de code inutilisé faut-il optimiser un script ?
Les scripts en defer ou async sont-ils toujours exclus des audits JavaScript inutilisé ?
Comment savoir si un script signalé comme inutilisé est vraiment supprimable ?
Le JavaScript inutilisé impacte-t-il directement le ranking Google ?
🎥 From the same video 8
Other SEO insights extracted from this same Google Search Central video · published on 29/11/2023
🎥 Watch the full video on YouTube →
💬 Comments (0)
Be the first to comment.