Official statement
Other statements from this video 8 ▾
- □ Que se passe-t-il réellement quand Google vous inflige une action manuelle ?
- □ Un site hors ligne peut-il vraiment détruire votre trafic de toutes les sources (et pas seulement Google) ?
- □ Pourquoi une balise noindex provoque-t-elle une baisse de trafic progressive et non brutale ?
- □ Les Core Updates provoquent-elles vraiment des changements progressifs plutôt que des chutes brutales ?
- □ Pourquoi analyser 16 mois de données Search Console lors d'une chute de trafic ?
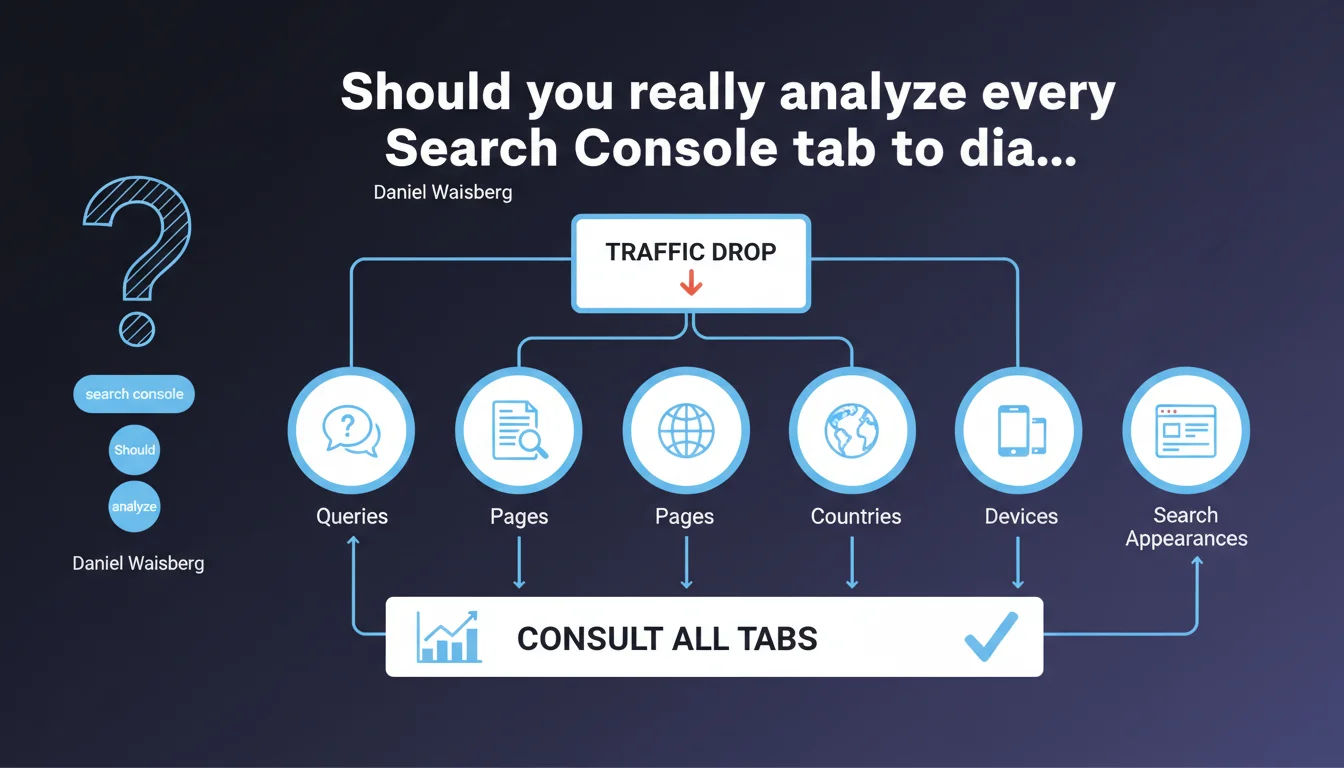
- □ Comment analyser correctement une baisse de trafic SEO sans se tromper de diagnostic ?
- □ Pourquoi devriez-vous arrêter d'analyser votre trafic SEO de manière globale ?
- □ Pourquoi Google ajoute-t-il des annotations dans Search Console et comment les interpréter ?
Google recommends systematically checking all tabs in the Performance report (queries, pages, countries, devices, search appearances) before concluding on the source of traffic variation. This approach prevents misdiagnosis and precisely identifies the scope truly impacted by an algorithmic or technical change.
What you need to understand
Why does Google insist on this multi-dimensional approach?
Because a traffic drop visible at the global level can mask a more nuanced reality. A site might lose 20% of clicks on mobile while gaining 5% on desktop — the aggregated figure only tells part of the story.
Concretely, if you only check the "Queries" tab without verifying "Devices" or "Pages," you risk attributing the variation to a content issue when it's actually a technical problem specific to smartphones. Or worse: spending resources on unnecessary optimizations.
What are the priority analysis angles in Search Console?
The Performance report offers five main dimensions: queries (keywords generating traffic), pages (impacted URLs), countries (geographic segmentation), devices (mobile/desktop/tablet), and search appearances (featured snippets, images, videos).
Each dimension can reveal a pattern invisible in the others. A drop isolated to "Shopping" or "Images" indicates a structured markup issue, not textual content. A decline only in Germany suggests an aggressive local competitor or regional penalty.
How do you interpret cross-tab variations?
Let's be honest: the difficulty lies in deep reading. A page can lose traffic on its main query while gaining on secondary intents — the net delta remains negative, but the corrective action differs entirely.
Google doesn't detail here how to cross this data effectively. The interface allows filtering (e.g., "mobile + France + page X"), but without clear methodology, you're navigating blind.
- Systematically check all 5 tabs before any conclusion
- Use combined filters to isolate a specific segment (device + country + search type)
- Compare periods over homogeneous ranges (same number of days, same seasonality)
- Export data for cross-analysis in a spreadsheet if Search Console isn't enough
SEO Expert opinion
Is this recommendation actually followed by SEO professionals?
In practice, many SEO audits settle for a quick overview of queries and pages — the "Countries" or "Search Appearances" tabs remain underutilized. Why? Because the Search Console interface doesn't make it easy to detect complex patterns.
A seasoned SEO expert knows that a localized variation ("mobile only in France") requires different diagnosis than a global drop. But for a beginner, the tool remains opaque — Google offers neither targeted alerts nor suggestions for correlations. [To verify]: no Google study proves this manual multi-tab approach is more effective than an anomaly detection algorithm.
What limitations does this methodology impose?
First issue: Search Console sometimes aggregates data with a 2-3 day delay. If you analyze a drop on Monday, weekend figures may be incomplete — and your conclusions skewed.
Second problem: privacy thresholds. Google masks certain queries or pages if volume is too low. Result? You see a 15% drop without being able to identify exactly which URLs or keywords are affected. It's frustrating, but that's the price of user data protection.
Does Google provide enough granularity for real diagnosis?
Frankly? No. Search Console remains a surface-level tool. For serious forensic analysis, you'll need to cross-reference with Google Analytics 4 (behavioral data), rank tracking tools (SEMrush, Ahrefs), and your server logs (actual Googlebot crawl).
Waisberg's statement is correct, but incomplete: it doesn't say what to do once you've identified "drop on mobile only." Should you check Core Web Vitals? JavaScript rendering? Your templates' mobile-first version? Google remains evasive.
Practical impact and recommendations
What should you concretely do after detecting a variation in Search Console?
First, don't panic. A 10-15% drop over one week could be statistical noise — especially if your site generates fewer than 1000 clicks/day. Wait 7-10 days to confirm the trend.
Next, apply a methodical investigation routine. Open Search Console, select the period in question, then go through each tab noting anomalies. If a dimension shows a marked divergence (e.g., -40% on mobile vs +5% on desktop), that's your entry point.
What errors to avoid when analyzing across tabs?
Error #1: comparing non-homogeneous periods. Never compare "this week" with "last week" if it contained a holiday or major event (Black Friday, elections, etc.). Instead use "last 28 days" vs "previous 28 days."
Error #2: ignoring devices. Most traffic now comes from mobile — a regression on this axis can kill your visibility even if desktop remains stable. Systematically check the mobile/desktop split whenever a variation appears.
Error #3: neglecting "Search Appearances." If you lose your featured snippets or rich results (recipes, FAQs, events), your CTR collapses even if your average position stays the same. Google won't alert you — it's up to you to monitor.
How do you structure an effective monitoring process?
Set up weekly alerts (via a Google Apps Script or third-party tool connected to the Search Console API). Define acceptable variation thresholds by dimension: for example, -10% on an isolated query may be normal, but -10% across "all pages" + "all devices" warrants immediate investigation.
Document each diagnosis in a spreadsheet: date, detected symptom (e.g., "mobile Germany drop -25%"), hypothesis, corrective action, result after 2 weeks. This traceability lets you identify recurring patterns — and refine your responsiveness.
- Check all 5 tabs (Queries, Pages, Countries, Devices, Search Appearances) at each analysis
- Export data to cross dimensions (e.g., mobile + country X + query Y)
- Compare homogeneous periods (same duration, same seasonality)
- Specifically monitor mobile devices and rich search appearances
- Wait 7-10 days before concluding on a trend
- Cross-reference Search Console with GA4 and your server logs for complete diagnosis
- Document each investigation to build internal knowledge base
❓ Frequently Asked Questions
Dois-je analyser tous les onglets même si ma baisse de trafic semble évidente ?
Search Console suffit-il pour diagnostiquer une pénalité algorithmique ?
Comment savoir si une variation est du bruit statistique ou un vrai problème ?
Pourquoi Google ne propose-t-il pas d'alertes automatiques sur les anomalies multi-dimensionnelles ?
Les filtres combinés de Search Console sont-ils fiables pour isoler un segment précis ?
🎥 From the same video 8
Other SEO insights extracted from this same Google Search Central video · published on 29/03/2023
🎥 Watch the full video on YouTube →
💬 Comments (0)
Be the first to comment.