Official statement
Other statements from this video 9 ▾
- □ Pourquoi Google n'indexe-t-il jamais l'intégralité d'un site web ?
- □ Pourquoi vos pages restent-elles en 'Découvert - actuellement non indexé' ?
- □ Faut-il vraiment attendre que Google indexe vos pages ?
- □ Comment Googlebot ajuste-t-il sa vitesse de crawl en fonction des performances de votre serveur ?
- □ Les problèmes de serveur ne touchent-ils vraiment que les très gros sites ?
- □ Pourquoi Google refuse-t-il d'indexer vos pages en statut 'Découvert' ?
- □ Google peut-il vraiment ignorer des pans entiers de votre site à cause d'un pattern de faible qualité ?
- □ Le maillage interne suffit-il vraiment à faire indexer vos pages découvertes ?
- □ Faut-il vraiment se préoccuper des pages non indexées par Google ?
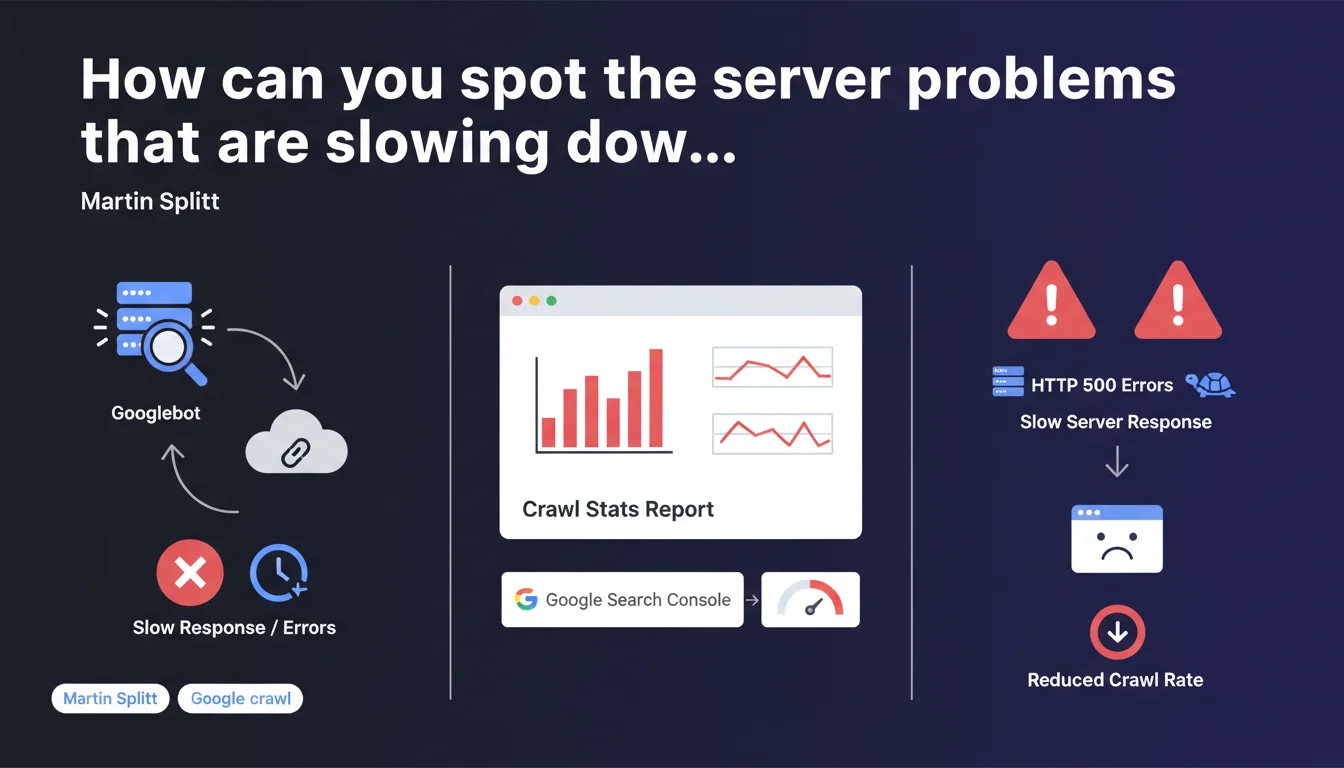
Martin Splitt recommends checking the Crawl Stats report in Google Search Console, particularly the Reply section, to identify whether your server is responding slowly or generating HTTP 500 errors when Googlebot crawls your pages. It's an essential diagnostic tool for detecting technical issues that prevent optimal crawling of your pages.
What you need to understand
Why does Google emphasize this specific section of the Crawl Stats report?
The Crawl Stats report in Google Search Console offers a detailed view of Googlebot activity on your site. The Reply section in particular reveals how your server responds to robot requests: response time, HTTP codes returned, server errors.
If your server takes too long to respond or multiplies 500 errors, Googlebot slows down or stops its exploration. Result? Uncrawled pages, unindexed pages, invisible in the SERPs. This is a major friction point that many sites overlook.
What concrete signals should you monitor in this section?
The Reply section highlights two types of critical problems: high response times (server latency) and HTTP 500 error codes (internal server errors). These two indicators reflect infrastructure struggling to handle Googlebot traffic.
A slow or unstable server sends a negative signal to Google — your site becomes expensive to crawl in terms of resources. Google then adjusts its crawl budget downward, which particularly penalizes large sites with thousands of URLs.
Does this recommendation apply to all types of sites?
No. Small sites with just a few dozen pages are rarely impacted by these issues — Google crawls all their content without difficulty. This recommendation is mainly aimed at medium to large sites, e-commerce platforms, content portals with high URL volume.
- Crawl Stats Reply: key section for identifying server performance issues
- HTTP 500 errors: signal unstable infrastructure that slows down Googlebot
- High response times: reduce the crawl budget allocated by Google
- Differentiated impact: critical for large sites, marginal for small ones
SEO Expert opinion
Does this statement really bring anything new?
Not really. The Reply section of the Crawl Stats report has existed for years and experienced SEOs consult it regularly. What Splitt is doing here is reminding us of a basic practice — useful for beginners, redundant for seasoned practitioners.
The real problem? Google provides no precise threshold values. After how many milliseconds does a response time become problematic? What rate of 500 errors is acceptable? Radio silence. We remain in the fog, as often happens.
What field nuances should be added?
Not all 500 errors are equal. A one-off error during an unexpected traffic spike won't have the same impact as a structural 5% error rate over several weeks. Google smooths its observations over time — an isolated incident doesn't destroy your crawl budget.
Similarly, high response time can stem from multiple sources: under-sized server, poorly optimized database, heavy middlewares, failing CDN. The Crawl Stats report identifies the symptom, but in-depth diagnosis requires additional technical tools (server logs, APM, infrastructure monitoring).
In what cases is this recommendation insufficient?
Checking Crawl Stats Reply is a starting point, not a complete solution. If you detect anomalies, you'll need to cross-reference this data with your raw server logs, your monitoring tools (New Relic, Datadog, etc.) and potentially your CDN logs.
Another limitation: the report aggregates data by day, which masks intra-day peaks. A performance drop at 2 PM for 30 minutes may go unnoticed in a daily average. For fine-grained analysis, leverage your own tools — Google Search Console remains a macroscopic view.
Practical impact and recommendations
What should you concretely do to leverage this recommendation?
First step: open Google Search Console, go to Settings > Crawl Statistics, then switch to the Reply tab. Examine the graphs over the last 90 days — identify 500 error spikes and abnormal variations in average response time.
If you detect anomalies, cross-reference these dates with your internal events: application deployments, server migrations, traffic spikes, marketing campaigns. Often, a crawl problem coincides with an infrastructure change or undocumented technical incident.
What mistakes should you avoid when analyzing this data?
Don't panic over an isolated spike. Google expects problems to be recurring and significant before adjusting its crawl budget. A one-hour isolated incident won't have lasting impact if your server becomes stable again afterward.
Another common mistake: focusing solely on average response time. Look at distribution too — a high P95 (95th percentile) reveals that some requests are abnormally slow even if the average seems correct. Unfortunately, Google Search Console doesn't expose these details — hence the importance of your own monitoring tools.
How should you prioritize corrective actions?
Start by eliminating 500 errors — they're critical and signal pure server malfunction. Audit your application logs, identify failing endpoints, fix bugs or database timeouts. This is the absolute priority.
Next, tackle response times. Optimize your infrastructure: appropriately-sized server, application cache (Redis, Memcached), SQL query optimization, CDN implementation for static assets. If you're on heavy CMS (WordPress, Magento), consider specialized hosting or a decoupled architecture (headless).
- Check the Crawl Stats > Reply report in Google Search Console weekly
- Identify HTTP 500 error spikes and correlate them with your internal events
- Monitor average response time and spot progressive drifts
- Cross-reference GSC data with your raw server logs for accurate diagnosis
- Prioritize eliminating 500 errors before optimizing response times
- Set up continuous infrastructure monitoring (automatic alerts on thresholds)
- Test server load by simulating Googlebot traffic (load testing tools)
❓ Frequently Asked Questions
À quelle fréquence faut-il consulter le rapport Crawl Stats Reply ?
Un temps de réponse de combien de millisecondes est considéré comme problématique ?
Les erreurs 500 sporadiques impactent-elles réellement le crawl budget ?
Peut-on ignorer Crawl Stats Reply si on a déjà un monitoring serveur performant ?
Comment distinguer un problème serveur d'un problème applicatif dans ce rapport ?
🎥 From the same video 9
Other SEO insights extracted from this same Google Search Central video · published on 20/08/2024
🎥 Watch the full video on YouTube →
💬 Comments (0)
Be the first to comment.