Official statement
Other statements from this video 4 ▾
- □ Is Google Really Changing Its Rules or Just Repackaging Them With Search Essentials?
- □ Are Google Search Console's bubble charts really revolutionizing your SEO analysis?
- □ Why have image dimensions in HTML become essential for fixing CLS problems?
- □ Should you really delete problematic elements instead of fixing them for SEO?
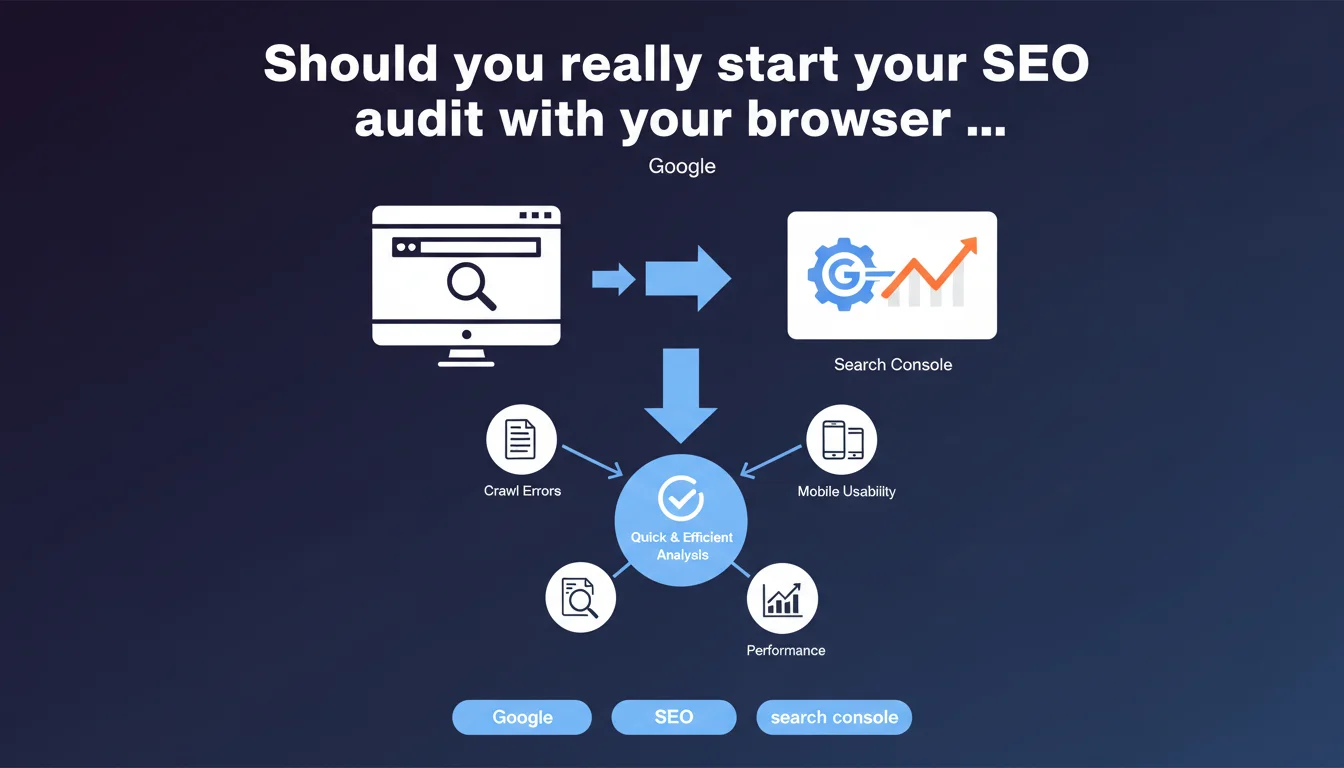
Google recommends starting any SEO analysis with a combination of browser + Search Console before exploring other tools or aspects of SEO. The idea: quickly gain ground-truth visibility of what the engine actually sees and identify critical issues without getting bogged down in secondary metrics. An approach that prioritizes efficiency over exhaustiveness during the initial diagnostic phase.
What you need to understand
Why does Google emphasize this minimalist approach?
The recommendation aims to avoid analysis paralysis. Too many SEOs lose hours in third-party tools before even understanding what Google actually sees. The browser reveals raw user experience — load times, mobile display, content accessibility. Search Console, on the other hand, exposes data directly from crawling and indexation.
This combination offers a quick diagnosis of major malfunctions: non-indexed pages, massive 404 errors, Core Web Vitals issues, gaps between rendered content and source HTML. All alarm signals that require immediate action before any fine-tuning optimization.
What can you really detect with this method?
The browser in inspection mode allows you to verify JavaScript rendering, effective HTML structure, meta tags, heading hierarchy. It's the equivalent of a ground-truth visual check — what users and Googlebot actually see.
Search Console complements this with performance data: queries generating impressions, click-through rate, indexation coverage, page experience signals. The tool also reveals crawl errors, sitemap issues, robots.txt anomalies. It's pure Google vision, without filter or third-party interpretation.
- Client vs server rendering: identify content invisible to Googlebot if JS doesn't execute properly
- Indexation gaps: submitted but excluded pages, unwanted canonicalizations, soft 404s
- Critical UX signals: LCP, CLS, FID directly measured on real-world data
- CTR opportunities: queries with high impressions but low clicks, title tags/meta descriptions to rework
- Blocking technical errors: unavailable resources, excessive server response times
Is this approach enough for a complete audit?
No, and Google doesn't claim otherwise. This is an initial analysis, not an exhaustive audit. The objective is to detect major structural issues and establish a prioritized action plan.
For an in-depth analysis, you'll inevitably need to cross-reference with other sources: server logs to understand actual Googlebot behavior, crawl tools to map architecture, analytics to measure engagement, backlink checkers to assess link profile. But starting with the browser + GSC duo allows you to save time and avoid false leads.
SEO Expert opinion
Is this recommendation consistent with observed field practices?
Absolutely. The most effective audits I've conducted systematically started with manual crawling via browser + diving into Search Console. Too many consultants jump directly to Screaming Frog or Semrush without verifying that Google actually indexes strategic pages correctly.
The risk? Optimizing for weeks on content that Googlebot doesn't even see properly. I've encountered sites where 40% of pages weren't indexed because of mismanaged render-blocking JavaScript — an issue detectable in 5 minutes with Chrome DevTools, but invisible in most standard crawlers.
What limitations should you keep in mind?
Search Console only surfaces data from the last 16 months and sometimes aggregates in a frustrating way. Some metrics lack granularity — it's impossible, for example, to segment Core Web Vitals by device type or page template with necessary precision.
The browser, on the other hand, shows only an instantaneous snapshot. A site may display correct LCP during your manual test, then collapse under real conditions (slow network, low-end device, empty cache). Search Console field data partially compensates, but remains aggregated.
[To verify] Google's recommendation deliberately remains vague on the frequency of this analysis. Is it a one-time audit or continuous monitoring? For a 50,000-page e-commerce site, this manual approach quickly reaches its limits — you need to automate part of the process.
In what cases does this method show its flaws?
On large sites with high volume, analyzing page by page via browser becomes impractical. You must then sample intelligently: critical templates, top landing pages, new categories. But sampling introduces bias — you can miss localized issues.
Sites with server-side rendered content varying by user-agent also pose problems. If rendering differs between Googlebot and a standard browser (involuntary cloaking, for example), manual analysis via Chrome won't reveal the gap. You must then use the Search Console URL inspection tool to force a Googlebot fetch.
Practical impact and recommendations
What should you do concretely right now?
Start by opening your site in Chrome DevTools (F12), Network tab, and simulate a slow 3G connection. Watch which resources block rendering, how long LCP takes to display, whether JavaScript errors break the experience. Do this on your 5-10 key page templates.
Next, dive into Search Console: Coverage section to identify excluded pages, Performance section to spot queries with high potential but low CTR, Experience section to measure Core Web Vitals in real conditions. Export the data, cross-reference it, prioritize quick wins.
- Verify that strategic pages appear in Google's index (site: query or URL inspection tool)
- Compare source HTML (Ctrl+U) with final rendering (Inspect) to detect JS-injected content not seen by Googlebot
- Identify massive 404 or soft 404 errors in GSC > Coverage and fix or redirect them
- Spot pages with high impressions but low CTR — rework title and meta description
- Analyze Core Web Vitals by URL groups and focus on high-traffic pages first
- Verify your XML sitemap is current and all important URLs are listed
- Test mobile rendering using Google's mobile optimization test tool — this is what the mobile-first index sees
What errors should you avoid during this initial analysis?
Don't rely solely on browser rendering from your workstation. Googlebot uses a specific Chrome version, and rendering can vary based on network conditions, cache, cookies. Systematically use the Search Console URL inspection tool to see exactly what Google indexed.
Another classic trap: analyzing only the homepage and a few corporate pages. Real issues often hide in deep pages — product sheets, old blog articles, paginated category pages. Sample intelligently to cover all template types.
Finally, don't confuse correlation with causation. If a page ranks poorly AND has poor LCP, LCP isn't necessarily the main problem. Cross-reference with backlink data, content quality, competition on the query. Search Console + browser provide clues, not absolute verdicts.
How should you structure this analysis to make it actionable?
Document everything in a spreadsheet: tested URL, detected issue, severity level (blocking/medium/low), recommended corrective action, status. Prioritize based on potential SEO impact and implementation complexity.
For a complex or large site, this diagnostic phase can quickly reveal heavy technical projects — poorly managed JavaScript migrations, failing silo link architectures, server performance issues. If internal skills are lacking or the volume of corrections exceeds your capacity, it may be wise to work with an SEO agency specializing in such issues, who can prioritize actions and orchestrate corrections with your technical teams.
❓ Frequently Asked Questions
Peut-on se passer totalement d'outils tiers si on utilise Search Console et le navigateur ?
Search Console affiche des données différentes de mes analytics — laquelle croire ?
Comment savoir si Googlebot voit bien mon contenu JavaScript ?
Faut-il analyser chaque page du site manuellement via le navigateur ?
Les données de Core Web Vitals dans Search Console suffisent-elles pour optimiser la performance ?
🎥 From the same video 4
Other SEO insights extracted from this same Google Search Central video · published on 16/02/2023
🎥 Watch the full video on YouTube →
💬 Comments (0)
Be the first to comment.