Official statement
Other statements from this video 4 ▾
- □ Is Google Really Changing Its Rules or Just Repackaging Them With Search Essentials?
- □ Should you really start your SEO audit with your browser and Search Console?
- □ Why have image dimensions in HTML become essential for fixing CLS problems?
- □ Should you really delete problematic elements instead of fixing them for SEO?
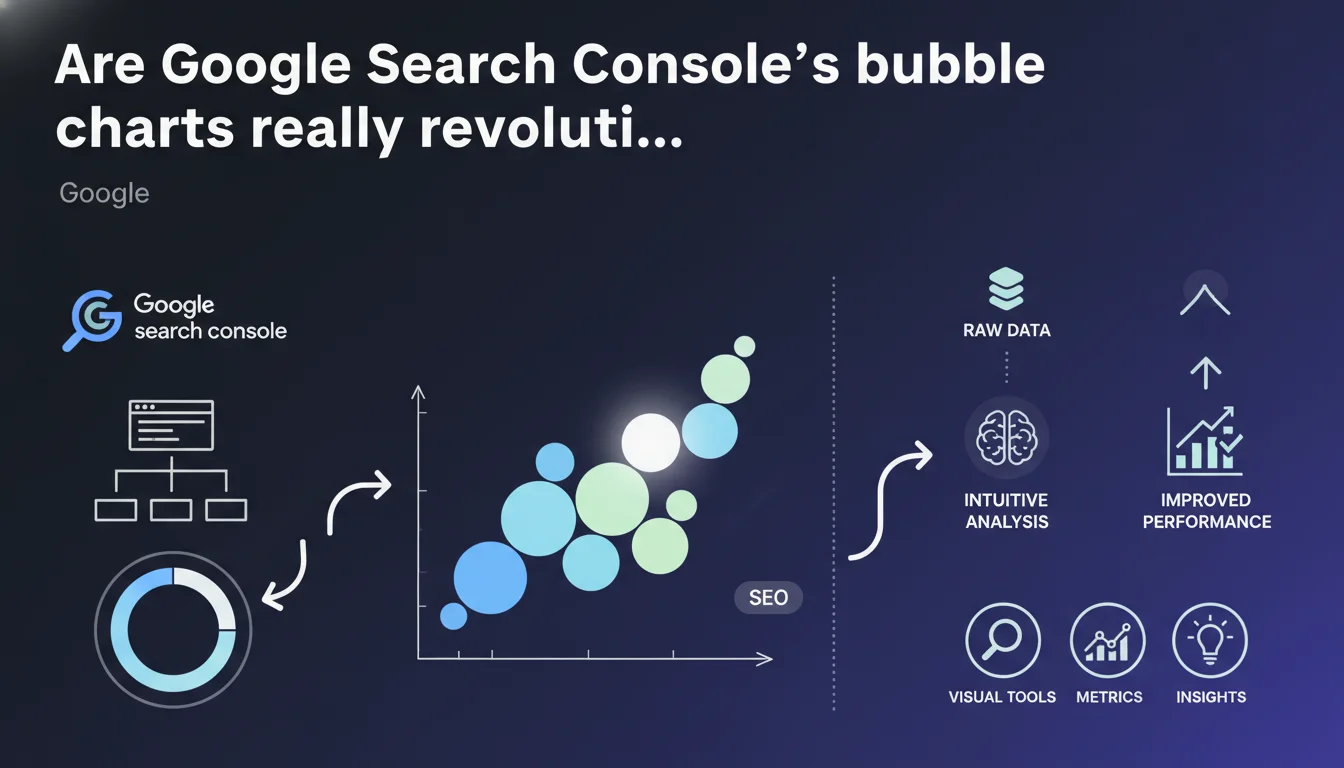
Google Search Console now integrates bubble chart visualizations to analyze performance data. These visual representations promise a more intuitive reading of search metrics, particularly to quickly identify high-potential pages or underperforming ones. The question remains whether the tool truly delivers operational efficiency gains.
What you need to understand
What do these bubble charts actually deliver?
The bubble charts allow you to cross multiple dimensions on a single visual: average position, click-through rate, number of impressions, and query volume. Each bubble represents a page or query, with its size varying according to impression volume.
Unlike traditional GSC tables, this representation makes it easier to detect patterns — for example, well-positioned pages but with abnormally low CTR, or high-volume queries where you're stagnating on page 2.
Who is this feature designed for?
These visualizations primarily target operational SEO professionals who deal with large data volumes daily. For a site with a few hundred pages, the usefulness remains limited — a simple Excel export is sufficient.
However, for e-commerce catalogs, media sites, or multi-topic platforms, visually identifying performance anomalies becomes significantly faster than manually sorting through 10,000 rows.
Which metrics are truly actionable?
The cross-reading of position versus CTR remains the most revealing. A page ranking 3rd with a 2% CTR signals a metadata problem or perceived relevance issue. Conversely, a position 8 ranking with 5% CTR indicates strong optimization potential if you climb a few positions.
Impression volume scales the bubbles and helps you prioritize: is it better to optimize a page ranking 12th with 50,000 monthly impressions or a page ranking 6th with 800 impressions? The graph makes this prioritization immediately clear.
- Quick detection of underperforming pages despite good rankings
- Visual identification of quick-win opportunities (pages ranking 8-15)
- Prioritization based on actual impression volume rather than assumptions
- Comparative analysis between site segments or time periods
SEO Expert opinion
Does this visualization really change the operational game?
Let's be honest: a bubble chart, however pretty, doesn't replace structured analysis. The tool facilitates visual detection, but you still need to export the data to build a serious optimization roadmap.
The real gain lies in the initial detection phase — scanning 5,000 queries in 30 seconds to identify problem clusters. After that, you need to leave GSC and work on semantics, content, and structure. The chart doesn't tell you *why* your CTR is low, just that it is.
Aren't the limitations obvious?
[To verify] The temporal granularity of the data remains unclear. Do these charts aggregate over 28 rolling days? Can you isolate specific periods to measure the impact of an update? Google provides no clarification, which is problematic for rigorous causal analysis.
Another point: GSC still suffers from its usual limitations — sampling beyond a certain volume, truncated data on long-tail queries, variable freshness delays. A more readable chart doesn't correct these structural biases.
How consistent is this with observed field practices?
High-performing SEO teams already use third-party tools (Looker Studio, Tableau, Python) to cross these metrics. What Google provides here is democratization for less technical profiles — but at the cost of reduced flexibility.
Concretely? You won't be able to filter finely, create advanced custom segments, or automate alerts. For a quick audit or client presentation, it's effective. For continuous monitoring, you'll quickly return to your in-house dashboards.
Practical impact and recommendations
How to leverage these charts in your SEO routine?
Integrate reading the bubble charts into your monthly reporting, even before opening your exports. The objective: identify in 2 minutes the pages that deserve deeper analysis. Note the anomalies, then switch to the export to dig deeper.
Use GSC filters (device, country, search type) to segment your charts. A catastrophic CTR on mobile but correct on desktop? You have a mobile snippet display problem or loading speed issue impacting perceived relevance.
What mistakes should you absolutely avoid?
Don't focus solely on large bubbles. A small bubble at position 3 with 200 monthly impressions can represent an ultra-qualified query with high conversion potential — much more profitable than an 8th position on a generic query with 20,000 impressions.
Also avoid comparing apples and oranges: a chart mixing brand and generic queries makes no sense. Filter by intent or semantic segment before drawing conclusions.
- Scan charts by page category (product sheets, blog, category pages) to identify sectoral patterns
- Cross-reference with Analytics data to verify if good CTR translates into actual engagement (time on page, bounce rate)
- Automate monthly screenshots to track the visual evolution of performance clusters
- Never make an optimization decision based solely on the chart — always validate through semantic and competitive analysis
- Test different time windows to detect seasonality or algorithm update impacts
❓ Frequently Asked Questions
Ces graphiques remplacent-ils les exports CSV de la Search Console ?
Peut-on personnaliser les axes et les métriques affichées ?
Les données affichées souffrent-elles des mêmes limitations que les tableaux GSC ?
Comment interpréter une grosse bulle en position 15 ?
Faut-il privilégier l'optimisation des pages à fort CTR ou celles à faible CTR ?
🎥 From the same video 4
Other SEO insights extracted from this same Google Search Central video · published on 16/02/2023
🎥 Watch the full video on YouTube →
💬 Comments (0)
Be the first to comment.