Official statement
Other statements from this video 11 ▾
- □ Faut-il vraiment compter sur les service workers pour le SEO ?
- □ Googlebot peut-il indexer un site qui dépend de service workers pour afficher son contenu ?
- □ Googlebot ignore-t-il vraiment les service workers sur votre site ?
- □ Comment diagnostiquer les problèmes d'indexation causés par les service workers dans Search Console ?
- □ Comment les outils de test en direct de Google révèlent-ils les failles de rendu de votre site ?
- □ Pourquoi la collaboration avec les développeurs est-elle la clé pour débloquer les problèmes d'indexation ?
- □ Faut-il vraiment injecter des console.log pour diagnostiquer les échecs de rendu côté Googlebot ?
- □ Pourquoi les service workers peuvent-ils rendre votre contenu invisible pour Googlebot ?
- □ Faut-il vraiment vérifier le HTML rendu dans Search Console pour diagnostiquer vos problèmes d'indexation ?
- □ Votre page indexée mais invisible : problème technique ou simplement mal classée ?
- □ Comment désactiver un service worker pour diagnostiquer des problèmes SEO ?
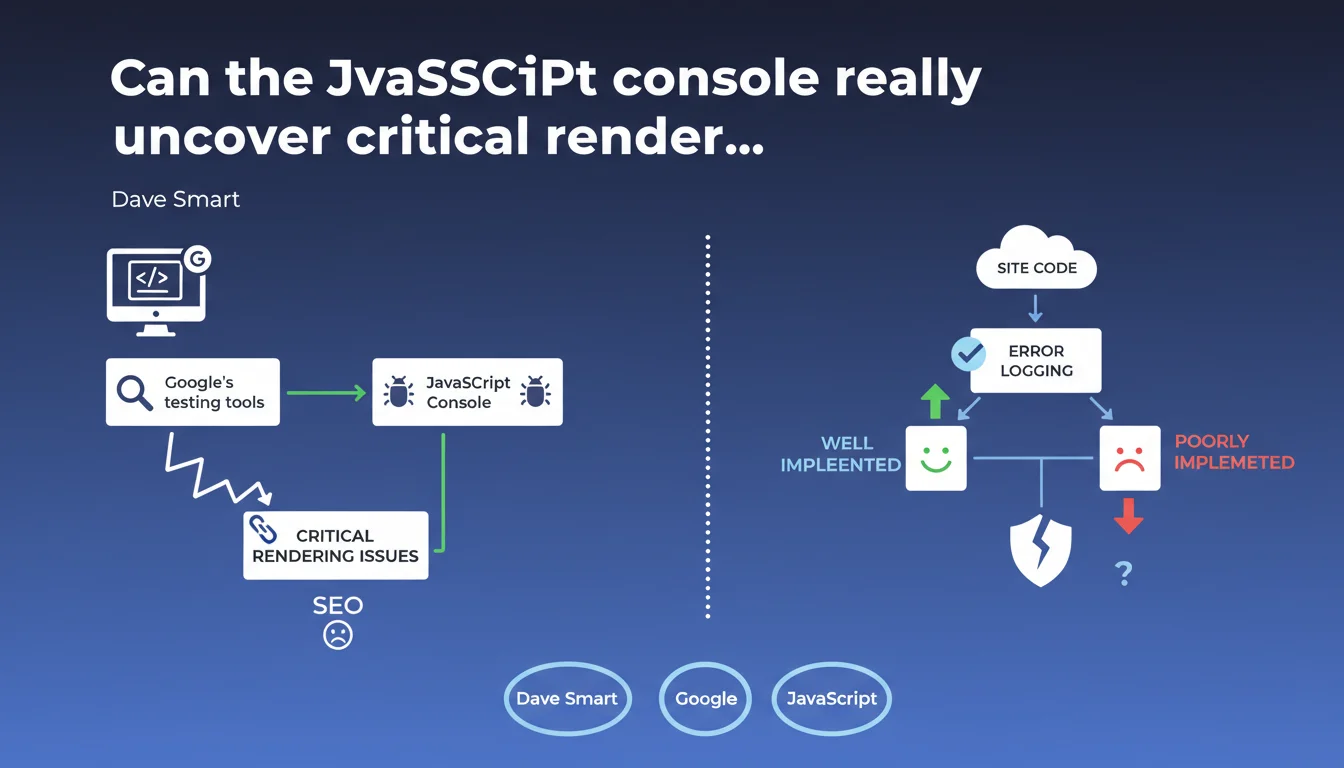
The JavaScript console in Google's testing tools can diagnose rendering problems, but its effectiveness depends entirely on the quality of logging implemented in your code. Google implicitly admits that not all rendering issues are automatically detectable — it's up to developers to log the right information.
What you need to understand
Google confirms that the JavaScript console displayed in its testing tools (Search Console, Mobile-Friendly Test, Rich Results Test) can help identify rendering problems. But this statement contains a catch: the usefulness of this console depends on how well the site logs its errors.
In other words, if your code doesn't properly log events and errors, the console will remain silent even if rendering fails.
Why doesn't the JavaScript console detect everything automatically?
The console only displays errors that the browser considers JavaScript exceptions or that the developer has explicitly logged via console.error(), console.warn(), etc.
A component that fails to load due to faulty business logic doesn't necessarily generate a JavaScript error — it might simply display nothing. Without explicit logging, there's no way to know what went wrong.
What information can you actually get from this console?
Classic errors: blocked resources (CORS, CSP), failed scripts, unhandled promises, timeouts. These are the obvious technical errors, the ones the browser catches natively.
Business or functional errors — an A/B test that hides content, a misconfigured paywall — require explicit logging to be detected.
- Google's JavaScript console displays errors natively captured by the browser
- Its effectiveness depends on the quality of logging implemented in the code
- Functional or business errors are only visible if explicitly logged
- A silently failed render can go unnoticed without adequate logging
- This console is a diagnostic tool, not an automatic detector of all problems
SEO Expert opinion
Is this statement consistent with what we observe in the field?
Yes, absolutely. We regularly see sites complaining that Google isn't indexing them correctly, while the JavaScript console is empty. When we dig deeper, we discover that rendering fails due to conditional logic or a timeout — but no error is logged.
Google is placing responsibility on developers here: if you want to diagnose your rendering problems, implement robust logging. That's honest, but it also means the tool isn't magic.
What nuances should be added to this claim?
The statement remains vague about what constitutes "good" logging. No specific criteria, no recommendations about what should be logged first. [To verify] the extent to which Google actually uses these logs to adjust its rendering or diagnose problems.
A rarely highlighted point: the console displayed in Google's tools isn't necessarily identical to the one in a standard browser. Rendering happens in a headless environment (Chromium), with potentially different timeouts.
In what cases is this tool actually useful?
Practically speaking? When you have an identified rendering problem and you're trying to understand why. The console can reveal a blocked script, a resource returning a 404 error, a CSP violation.
It's far less useful for diagnosing subtle issues or silent failures — unless you've anticipated this by implementing explicit monitoring.
Practical impact and recommendations
What should you do concretely to leverage this tool?
First, audit your JavaScript logging. Verify that critical errors (component loading failures, timeouts, API errors) are properly captured and logged. Use try/catch blocks around sensitive sections, and explicitly log failure states.
Next, test your site with Google's tools (Search Console, Mobile-Friendly Test) and systematically check the JavaScript console. Compare it with your browser's developer console — differences can reveal issues related to headless rendering.
What errors should you avoid when implementing logging?
Don't log everything and anything — too much noise makes the console unreadable. Focus on errors critical to rendering: main content loading failures, hydration errors (for JS frameworks), blocking API timeouts.
Avoid massive console.log() statements in production — they clutter unnecessarily. Prefer console.error() or console.warn() for real alerts, and disable debug logs once the site is live.
- Audit current JavaScript logging to identify blind spots
- Implement try/catch blocks around critical sections (content loading, APIs)
- Explicitly log functional rendering failures (paywalls, A/B tests, conditional content)
- Regularly test with Google's tools and check the JavaScript console
- Compare Google's console with a standard browser to spot differences
- Clean up non-critical logs to avoid noise in production
- Document recurring error patterns to streamline future diagnostics
Google's JavaScript console is a valuable diagnostic tool, but it only reveals what your code allows it to reveal. Robust and targeted logging is essential to fully leverage this tool.
Setting up effective JavaScript monitoring and optimizing rendering for Googlebot can be technical and time-consuming. If you consistently see gaps between expected and Google-indexed rendering, working with an SEO agency specializing in technical issues can help you quickly identify blockers and implement solutions tailored to your tech stack.
❓ Frequently Asked Questions
La console JavaScript de Google affiche-t-elle les mêmes erreurs qu'un navigateur classique ?
Si ma console JavaScript est vide, cela signifie-t-il que mon rendu est parfait ?
Quels types d'erreurs devrais-je prioritairement logger pour le SEO ?
Google utilise-t-il ces logs pour ajuster son indexation ?
Faut-il désactiver tous les console.log() en production ?
🎥 From the same video 11
Other SEO insights extracted from this same Google Search Central video · published on 01/11/2022
🎥 Watch the full video on YouTube →
💬 Comments (0)
Be the first to comment.