Official statement
Other statements from this video 4 ▾
- □ Comment Search Console peut-elle révéler les véritables blocages de votre indexation ?
- □ Comment exploiter les pages à fort potentiel de clics dans la Search Console ?
- □ Comment diagnostiquer pourquoi Google n'affiche pas vos contenus actualisés ?
- □ Comment exploiter l'export des données Search Console pour booster vos analyses SEO ?
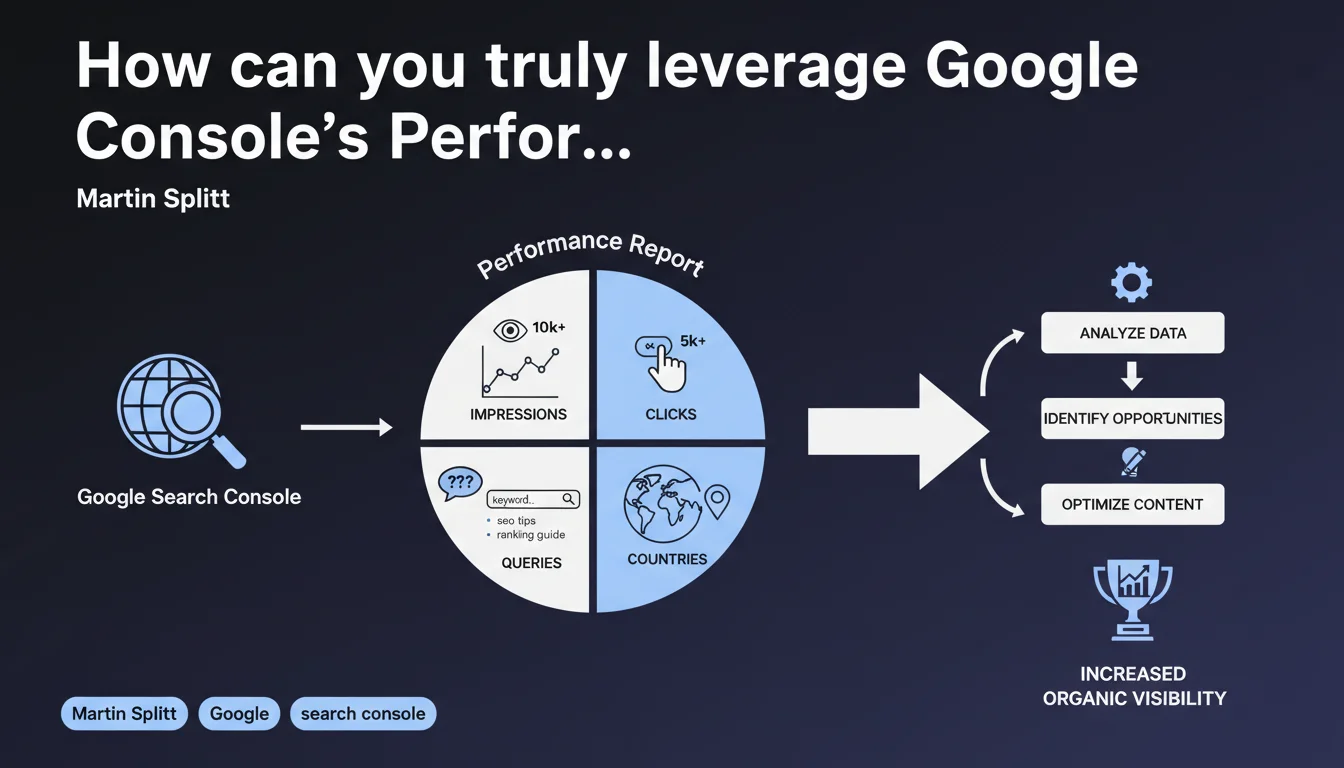
Google emphasizes that the Google Search Console Performance Report aggregates essential data to measure a site's visibility: impressions, clicks, traffic-generating queries, and geographical origin of users. The challenge for an SEO professional is to transform this raw data into actionable insights to optimize positioning and CTR.
What you need to understand
What is Google telling us exactly in this statement?
Martin Splitt reminds us of the existence and function of the Performance Report in Search Console, a central tool for any SEO professional. This report compiles four fundamental dimensions: the frequency of appearance of your pages in search results (impressions), the number of actual clicks, the triggering queries, and the geographical location of searches.
This statement brings no technical revelation — it functions more as a pedagogical reminder of basic features. Nothing new, but a useful framework for returning to fundamentals.
Why does this statement deserve our attention?
Because many practitioners underutilize this report. Too often, we simply watch the charts without digging into segments, filters by page, device, or search type (Web, Images, Videos).
The real value of Search Console doesn't lie in global figures, but in the granularity of the data — identifying pages that generate impressions without clicks, queries with high untapped potential, or performance gaps between countries.
What are the limitations of this report that Google doesn't mention?
Google never clarifies that Performance Report data is sampled beyond a certain volume, nor that reported impressions don't always correspond to actual visibility (scrolling, position in enriched results).
Moreover, the report doesn't distinguish between standard organic impressions and impressions in enriched SERP blocks (People Also Ask, Featured Snippets, etc.), which can skew your actual CTR analysis.
- The Performance Report aggregates impressions, clicks, queries, and geolocation — but you must know how to segment it to extract value.
- Data is sometimes sampled and impressions don't always reflect effective visibility.
- The distinction between result types (organic, enriched, images) isn't always clear in the interface.
SEO Expert opinion
Is this statement aligned with practices observed in the field?
Yes, but it skims the surface. In practice, the Performance Report is a starting point, not an end in itself. Experienced professionals systematically cross-reference this data with Google Analytics 4, third-party tools (Ahrefs, SEMrush), and internal crawls to obtain a 360° view of performance.
The real challenge is interpretation. A low click-through rate on a high-volume query can signal a title/meta description problem, a SERP dominated by enriched results, or an insufficient average position. Without context, raw figures tell you nothing.
What nuances should we add to this official vision?
Google presents the Performance Report as a visibility tracking tool, but you must understand that visibility doesn't come down to impressions. A page can generate 10,000 impressions in positions 8-10 — technically visible, but commercially invisible.
Furthermore, the geographical dimension is often poorly exploited. Many practitioners don't realize their site attracts traffic from non-targeted countries, which can reveal unexpected market opportunities or hreflang targeting problems.
In what cases is this report insufficient?
The Performance Report is silent on causes. It tells you your clicks dropped 30% on a given query, but it will never explain whether it's because a competitor took your spot, an algorithm update, or seasonality.
Similarly, it doesn't capture zero-click queries — those where Google displays the answer directly in the SERP. Your page may lose traffic while maintaining impressions if Google increasingly extracts your content in Featured Snippets.
Practical impact and recommendations
How do you concretely exploit this report to improve your performance?
First step: segment by result type (Web, Images, Videos, News). Many sites ignore they're generating traffic via Google Images, when this channel could be optimized with precise alt tags, a dedicated sitemap, and NextGen format images.
Next, filter by device (desktop, mobile, tablet). CTR gaps between mobile and desktop often reveal UX problems or truncated snippets. If your mobile CTR is consistently lower, your title is probably too long or poorly structured.
What errors should you avoid when analyzing this data?
Don't focus solely on top queries. Queries in positions 5-15 with decent volume often represent your best ROI — targeted content work can push them to top 3 quickly.
Also avoid comparing non-homogeneous periods (e.g., comparing December and January without accounting for seasonality). Always use the year-over-year comparison function to neutralize calendar effects.
What methodology should you adopt to transform this data into action?
Regularly export data to a spreadsheet or BI tool to create customized dashboards. Cross-reference queries with your business objectives — identify those that drive conversions, not just clicks.
Automate alerts on abnormal variations (sudden drop in clicks, drop in impressions on a strategic page). The Search Console API allows you to script these monitors and react in real time.
- Segment your reports by search type (Web, Images, etc.) and by device
- Identify pages with high impression volume but low CTR — optimize titles and meta descriptions
- Spot queries in positions 5-15: these are your quick wins
- Cross-reference Search Console data with GA4 to measure actual business impact
- Export and historize your data to detect long-term trends
- Use geographical filters to identify unexpected markets
❓ Frequently Asked Questions
Les impressions dans Search Console correspondent-elles à une visibilité réelle dans les résultats ?
Pourquoi mon CTR moyen est-il si faible alors que mes positions sont correctes ?
Peut-on se fier aux données de Search Console pour mesurer l'impact d'une mise à jour d'algorithme ?
Comment identifier les requêtes à fort potentiel qui méritent d'être travaillées en priorité ?
Faut-il privilégier l'analyse par page ou par requête dans Search Console ?
🎥 From the same video 4
Other SEO insights extracted from this same Google Search Central video · published on 09/11/2023
🎥 Watch the full video on YouTube →
💬 Comments (0)
Be the first to comment.