Official statement
Other statements from this video 7 ▾
- □ Googlebot ignore-t-il vraiment le scroll et les interactions utilisateur ?
- □ Le DOM du navigateur reflète-t-il vraiment ce que Google indexe ?
- □ Les DevTools suffisent-ils vraiment pour déboguer vos problèmes SEO techniques ?
- □ Pourquoi les en-têtes de réponse HTTP sont-ils cruciaux pour votre référencement ?
- □ Pourquoi usurper le user agent de Googlebot dans votre navigateur ne sert à rien ?
- □ Pourquoi Google vérifie-t-il la présence du contenu dans le DOM plutôt que dans le HTML brut ?
- □ Faut-il vraiment bannir le lazy loading et le scroll infini pour être indexé par Google ?
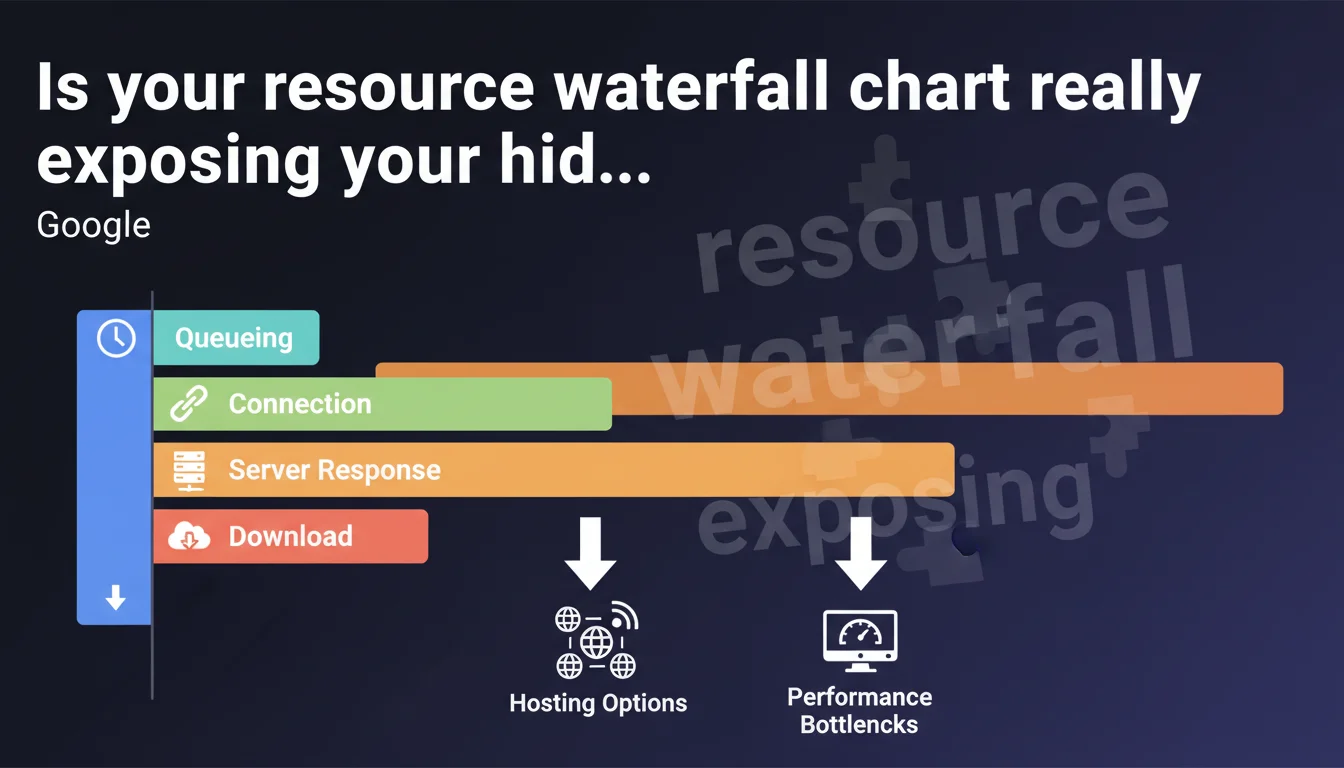
Google emphasizes analyzing the waterfall in the Network tab of DevTools to identify where loading time is actually being lost: queueing, connection, TTFB, or download. Abnormal latencies on connection or download often signal a hosting issue that needs priority fixing.
What you need to understand
What exactly does a waterfall diagram reveal?
The waterfall chart breaks down each HTTP request into distinct phases: queueing, connection establishment (TCP + SSL/TLS), server response time (TTFB), and actual resource download. This granularity enables precise diagnostics of where delays accumulate.
A 500 KB JavaScript file taking 3 seconds to load might suffer from a 2-second TTFB (slow server) or a 2.8-second download (insufficient bandwidth). The solutions are completely different depending on which bottleneck you identify.
Which time-consuming stages should raise red flags?
Google explicitly highlights two indicators: long connection times (several hundred milliseconds) and excessive download times. The first often reveals high network latency between the user and server — typical of hosting without a CDN or geographically poorly positioned.
The second indicates a bandwidth limitation on the server side or insufficient compression (GZIP/Brotli). If TTFB remains acceptable but download drags on, it's bandwidth or web server configuration throttling performance.
Why does Google mention "different hosting options"?
This deliberately vague phrasing covers multiple levers: transitioning from shared hosting that's saturated to a VPS or dedicated server, adopting a CDN to reduce geographic latency, or switching to a provider offering better network guarantees (peering, backbone).
The implication is clear: if the waterfall consistently shows long connection or download phases across multiple critical resources, your infrastructure is at fault — not just your code or browser cache.
- The waterfall breaks down each request into queueing, connection, TTFB, and download
- High connection times signal network latency or missing CDN
- Long download times indicate limited bandwidth or absent compression
- Google recommends reviewing your hosting if these phases are chronically slow
- The waterfall is accessible in the Network tab of DevTools
SEO Expert opinion
Does this recommendation match real-world diagnostics?
Absolutely. The waterfall remains the first-line tool for any serious performance audit. Synthetic tools (PageSpeed Insights, Lighthouse) give an overall score, but the waterfall shows where time is being wasted. Across thousands of audits, TTFBs >600 ms and downloads dragging on uncompressed CSS/JS rank among the most frequent causes of poor Core Web Vitals.
What's less often mentioned: a clean waterfall doesn't guarantee good LCP if critical resources aren't prioritized. Google focuses here on infrastructure, but request sequencing (preload, fetchpriority, inclusion order) weighs just as much.
Should you always switch hosts if connection times are long?
Not necessarily. Before migrating, verify three things: HTTP/2 or HTTP/3 enabled (reduces multiple connection costs), Keep-Alive properly configured (avoids renegotiating TCP/SSL per request), and presence of a CDN with PoPs close to your audience.
A €5/month shared hosting provider can suffice if a CDN (Cloudflare, BunnyCDN) handles static assets. However, if the initial HTML (document root) shows TTFB >800 ms even after server-side cache optimization, then yes, the infrastructure is probably undersized.
What pitfalls lurk in waterfall analysis?
First pitfall: confusing total time with blocking time. A resource taking 2 seconds to load but running async/defer doesn't impact LCP if it's not critical. The waterfall doesn't say which resources are priority — you must cross-reference with Lighthouse's Critical Request Chains.
Second pitfall: testing from local DevTools over a 1 Gb/s fiber connection. Download times will be artificially low. Use throttling (Fast 3G, Slow 4G) or real RUM testing to capture median user experience.
Practical impact and recommendations
How do you quickly identify problem resources in the waterfall?
Open the Network tab in DevTools (F12), reload the page with cache disabled (Ctrl+Shift+R), then sort requests by Time column in descending order. Isolate the 5-10 slowest resources and examine their individual waterfall.
For each one, note which phase consumes the most time. If it's Waiting (TTFB), the server is taking too long to generate or serve the resource. If it's Content Download, the resource is too large or bandwidth is insufficient. If it's Initial connection, network latency is the culprit.
What concrete actions should you take based on the bottleneck identified?
High TTFB: Enable server-side caching (Varnish, Redis, Memcached if dynamic), implement aggressive browser caching for static assets, or optimize database queries if the backend is the constraint. On WordPress, a caching plugin (WP Rocket, LiteSpeed Cache) can cut TTFB by 10x.
Long connection time: Deploy a CDN to serve assets from geographically close PoPs. Verify HTTP/2 minimum is enabled (HTTP/3 if possible). Reduce the number of third-party domains to minimize multiple TCP/SSL negotiations.
Slow download: Compress all text assets with Brotli level 6+ (or GZIP level 9 minimum). Minify CSS/JS, convert images to WebP/AVIF, and enable lazy-loading on below-the-fold images.
- Sort requests by Time in the Network tab to find the 10 slowest
- Verify that HTTP/2 (minimum) and Keep-Alive are enabled server-side
- Enable Brotli or GZIP on all text assets (HTML, CSS, JS, JSON, SVG)
- Implement a CDN if connection times exceed 150 ms for your target audience
- Use DevTools network throttling to test under realistic conditions (Fast 3G, Slow 4G)
- Compare waterfalls from multiple geographic locations (WebPageTest multi-region)
- Monitor TTFB in production via RUM (Real User Monitoring) to catch regressions
❓ Frequently Asked Questions
Le waterfall des DevTools Chrome diffère-t-il de celui de Firefox ou Safari ?
Quel est le seuil acceptable pour un temps de connexion dans le waterfall ?
Un TTFB élevé impacte-t-il directement le LCP ?
Comment interpréter une phase de queueing longue dans le waterfall ?
Faut-il analyser le waterfall sur mobile ou desktop en priorité ?
🎥 From the same video 7
Other SEO insights extracted from this same Google Search Central video · published on 07/02/2023
🎥 Watch the full video on YouTube →
💬 Comments (0)
Be the first to comment.