Official statement
Other statements from this video 5 ▾
- □ L'API de vérification Search Console change-t-elle vraiment la gestion de propriété à grande échelle ?
- □ Faut-il vraiment commencer par Search Console avant d'investir dans des outils SEO complexes ?
- □ Comment positionner votre contenu sur les nouvelles surfaces de recherche de Google ?
- □ Search Labs : l'IA générative de Google va-t-elle redéfinir les stratégies SEO ?
- □ Google fait-il vraiment évoluer ses standards de recherche ou est-ce du vent ?
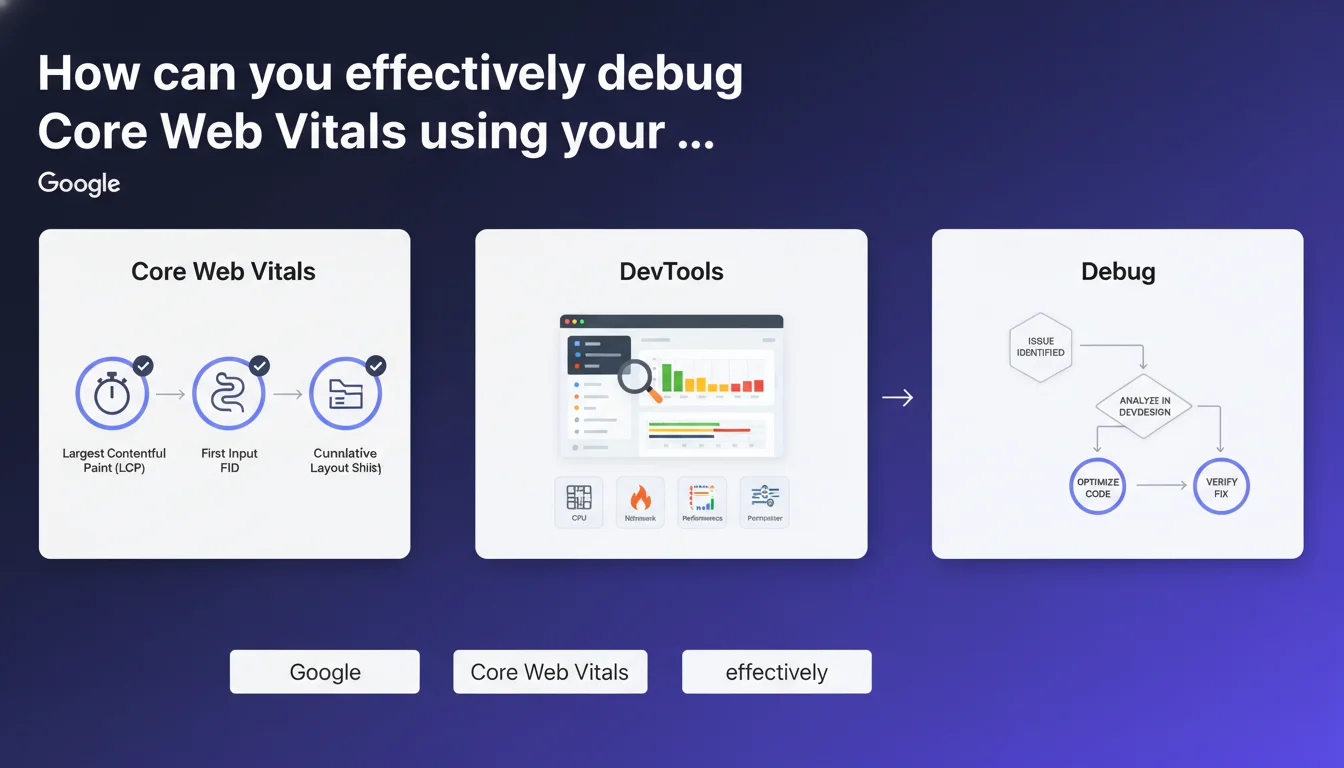
Google officially recommends using native browser DevTools to identify and resolve Core Web Vitals issues. This approach enables real-time technical analysis of performance metrics, delivering more precise diagnostics than mainstream tools like PageSpeed Insights.
What you need to understand
Why is Google pushing DevTools adoption over its own tools?
This recommendation marks a turning point in Google's communication strategy. Rather than exclusively promoting PageSpeed Insights or Lighthouse, Mountain View is inviting professionals to dive into Chrome's native diagnostic tools.
DevTools provide direct access to metrics under real-world conditions — no simulation, no artificial controlled environment. The Performance tab records complete page load, the Rendering tab visualizes Layout Shifts in real time, and the console exposes warnings related to CLS, LCP, or INP.
What concrete advantages does DevTools offer over automated tools?
Tools like PageSpeed Insights deliver a holistic diagnosis, often based on aggregated field data (CrUX). Useful for an initial assessment, but insufficient for fixing a specific problem.
DevTools allow you to reproduce the exact context of a user: specific mobile device, network throttling, simulated slow CPU. You can isolate each blocking resource, trace the Critical Rendering Path, identify the exact moment LCP triggers — and most importantly, understand why.
Which Core Web Vitals metrics are accessible via DevTools?
Chrome DevTools exposes the three official metrics: Largest Contentful Paint (LCP), Cumulative Layout Shift (CLS), and recently, Interaction to Next Paint (INP), which replaces First Input Delay.
The Performance tab displays a detailed timeline of paint events and shifts. The Rendering tab offers visual overlays to spot unstable zones. The console can even display values using Google's web-vitals.js API.
- Real-time diagnosis: no lag between modification and measurement
- Faithful user context: exact reproduction of field conditions
- Maximum granularity: precise identification of the faulty resource or script
- Rapid iteration: test, fix, re-test without running external crawls or simulations
- Access to raw data: complete timeline, CPU flamegraph, network waterfall
SEO Expert opinion
Is this recommendation consistent with practices observed in the field?
Yes and no. Advanced SEOs have been using DevTools for years — it's not new. What changes is that Google is now formalizing this usage and implicitly acknowledging the limitations of its own automated tools.
Concretely? PageSpeed Insights remains the reference tool for a quick audit or to show a score to a client. But once you need to fix a CLS of 0.15 that persists despite all standard fixes, DevTools becomes essential. The problem is that the learning curve is steep — and Google doesn't provide an exhaustive guide.
What nuances should be added to this statement?
Google doesn't clarify what level of technical expertise is required. The Performance tab in DevTools displays hundreds of lines, complex flamegraphs, timings in milliseconds. For an SEO without a developer background, it's intimidating.
Another point: DevTools measure performance on your local machine. If your connection is fiber and your CPU is modern, you won't see the issues a mobile user on 3G encounters. Hence the importance of throttling — but you need to know how to configure network and CPU throttling correctly.
In what cases does this approach show its limitations?
DevTools don't replace RUM (Real User Monitoring). They allow you to debug, not monitor. If you have 10,000 pages and CLS varies by template, you can't audit them all manually.
Moreover, some performance issues are conditional: a third-party script that misbehaves only under certain conditions (geolocation, A/B test, user-agent). DevTools capture one moment in time — not the diversity of real cases. That's where tools like SpeedCurve, Calibre, or Treo become relevant.
Practical impact and recommendations
What concrete steps should you take to master DevTools in a Core Web Vitals context?
First step: open Chrome DevTools (F12 or Cmd+Option+I on Mac) and familiarize yourself with the three critical tabs: Performance, Network, and Rendering. Each has a specific role.
The Performance tab records a complete loading session. Start recording, reload the page, stop. You get a timeline with LCP and CLS metrics visible. The CPU flamegraph shows which script monopolizes the processor — often heavy or poorly optimized JS.
The Rendering tab (accessible via More tools > Rendering) offers visual overlays: enable "Layout Shift Regions" to see in real time which zones move. Enable "Core Web Vitals" to display values directly on the page.
The Network tab exposes the loading waterfall. Identify resources blocking render: non-critical CSS, web fonts without font-display, LCP images loaded late.
What mistakes should you avoid when analyzing with DevTools?
Never test with cache enabled if you want to measure a first load — check "Disable cache" in the Network tab. Otherwise, your LCP measurements will be skewed by resources already in memory.
Don't forget to throttle connection and CPU. By default, DevTools tests on your machine — fast, modern. Switch to "Slow 3G" and "4x slowdown" to simulate a mid-range smartphone. That's where real issues appear.
Avoid confusing the Lighthouse score (accessible via the Lighthouse tab in DevTools) with actual measurements. Lighthouse simulates a load — it's an indicator, not ground truth. Official Core Web Vitals come from CrUX, based on real Chrome users.
How do you verify that the fixes you've made are effective?
After each modification (lazy-loading an image, preloading a font, deferring a script), re-record a Performance session. Compare LCP timings before/after. LCP should trigger earlier, ideally under 2.5 seconds.
For CLS, enable the "Layout Shift Regions" overlay and navigate the page. If blocks still move, look for missing dimensions on images, iframes without defined height, or fonts without fallbacks.
For INP, interact with the page (click, scroll, keyboard input) and watch the console. Delays above 200ms indicate a responsiveness problem — often linked to heavy JavaScript blocking the main thread.
- Open DevTools and familiarize yourself with the Performance, Network, and Rendering tabs
- Enable "Disable cache" to measure an authentic first load
- Throttle connection (Slow 3G) and CPU (4x slowdown) to simulate mobile conditions
- Record a Performance session and identify LCP, CLS, INP metrics in the timeline
- Enable "Layout Shift Regions" in Rendering to visualize element displacement
- Analyze the Network waterfall to spot blocking resources (CSS, JS, fonts)
- Compare timings before/after each fix to validate impact
- Don't rely solely on Lighthouse score — prioritize real CrUX measurements
- Document each identified issue and its fix for future reference
❓ Frequently Asked Questions
Les DevTools remplacent-ils PageSpeed Insights pour auditer les Core Web Vitals ?
Peut-on mesurer l'INP avec les DevTools ?
Faut-il tester systématiquement en mode navigation privée ?
Les corrections faites via DevTools impactent-elles immédiatement le classement Google ?
Quels throttling réseau et CPU utiliser pour simuler un mobile moyen ?
🎥 From the same video 5
Other SEO insights extracted from this same Google Search Central video · published on 29/12/2023
🎥 Watch the full video on YouTube →
💬 Comments (0)
Be the first to comment.