Official statement
Other statements from this video 1 ▾
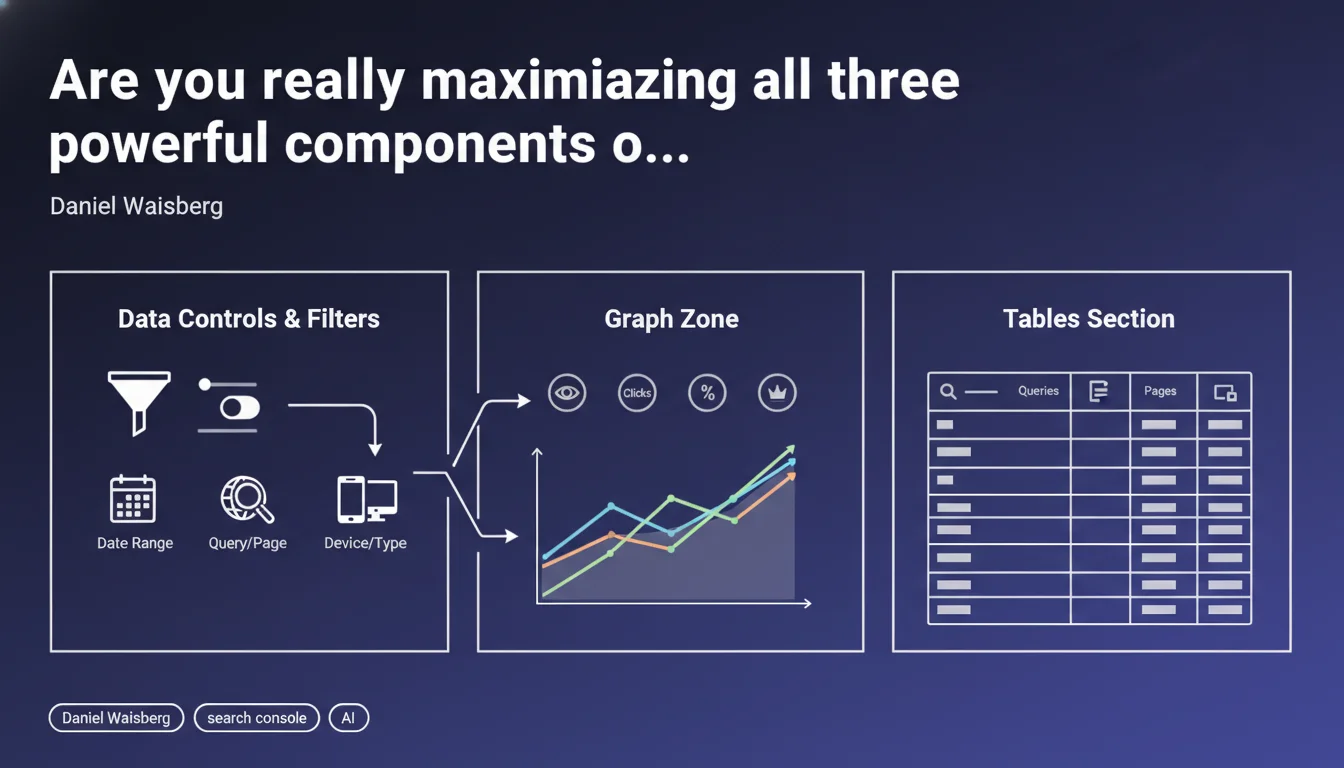
Google reminds us that the Search Console performance report is built around three key structural elements: data controls and filters, the graph zone, and data tables. Mastering these three components allows you to refine your analysis and precisely identify the optimization levers for your pages.
What you need to understand
Why does Google emphasize this three-part structure?
The performance report is one of the most consulted tools by SEO professionals, yet its usage often remains superficial. Google deliberately structures the interface around these three elements to encourage methodical analysis rather than simple consultation of global metrics.
Data controls and filters allow you to segment data granularly — by search type, country, device, query, page. The graph zone visualizes trends and correlations. The tables provide the line-by-line detail necessary for action.
What is the logic behind using these three components together?
The recommended approach follows a progressive analysis funnel. You start by defining the scope through filters (web search only? mobile? specific period?), then observe trends in the graph to identify anomalies or opportunities.
Finally, you dive into the tables to identify the specific pages or queries that need action. This approach prevents you from getting lost in aggregated data that masks the true optimization opportunities.
What risks arise if you neglect one of these three elements?
Ignoring filters leads to polluted analysis — mixing desktop and mobile, or including Google Images in your web search KPIs completely distorts your interpretations. Without the graph, you miss temporal trends and seasonality patterns.
And settling for just the graph without diving into the tables amounts to flying blind: you see things going up or down, but without knowing what to optimize concretely.
- Three inseparable pillars: filters to scope, graph to observe, tables to act
- Methodical approach required: don't skip steps in your analysis
- Segmentation is essential: each search type, device, and geography has its own dynamics
- Details make the difference: actionable insights are in the tables, not in aggregated views
SEO Expert opinion
Does this statement actually bring anything new to the table?
Let's be honest: this Google communication amounts to basic educational reminder rather than strategic revelation. Any SEO practitioner with six months of experience already knows this structure. This is content geared toward beginners or occasional Search Console users.
However — and this is where it gets interesting — the mere fact that Google feels compelled to publish this type of reminder suggests that many users are underutilizing the tool. Probably too many superficial consultations without real segmentation or deep analysis.
What are the unmentioned limitations of these three components?
Google fails to mention the important technical constraints that hinder data exploitation. Tables are limited to 1000 rows — which quickly becomes insufficient for a medium-sized site. CSV export only partially solves the problem because totals are capped. [To verify] on large sites where the Search Console API offers greater flexibility.
Another limitation: the data latency (minimum 48-72 hours) and aggregation that masks certain intra-day fluctuations. For real-time monitoring during a critical migration or deployment, Search Console remains too slow.
Do practitioners in the field really use these three components systematically?
In practice, we observe that many SEOs settle for the overall graph and basic filters. Systematic deep dives into the tables to cross-reference queries, pages, and countries remains less frequent than it should be.
Yet it is precisely in this granular analysis that opportunities hide — that query ranked at position 8 with many impressions but few clicks, that well-ranked page whose CTR suddenly collapses, that country where your visibility is soaring without you knowing why.
Practical impact and recommendations
How do you structure a truly effective Search Console analysis?
Always start by isolating the relevant search type (Web only in most cases, unless you're specifically working on Images or Videos). Then filter by device if your mobile strategy differs from your desktop strategy — which it should.
Set a coherent reference period. Comparing the last 28 days to the previous 28 days is often more relevant than a year-over-year comparison that ignores seasonality.
Which segments deserve systematic attention?
In the tables, sort by descending impressions then identify all queries ranked at positions 5-15: these are your quick win improvement opportunities. A gain of a few positions on an already-visible query often generates more traffic than lengthy work on a page 3 query.
Also isolate pages with abnormally low CTR for their average position — a symptom of uninspiring titles and meta descriptions or competing rich snippets that cannibalize your clicks.
What common mistakes must you avoid at all costs?
Never draw conclusions from too short a period. A 3-4 day fluctuation can be statistical noise, seasonality, or a temporary crawl bug. Wait at least 7-10 days of confirmed trend before taking action.
Another classic trap: analyzing average positions without looking at the distribution. An average position of 8 might mean you're stable at position 8, or that you're alternating between position 2 and position 15 — two radically different situations requiring opposite actions.
- Always filter by search type (Web) before any analysis
- Systematically segment mobile vs desktop for sites with differentiated strategies
- Cross-reference Queries and Pages views to identify cannibalizations
- Export data for advanced analysis beyond the 1000-row limit
- Compare equivalent periods (same day of week, same duration)
- Monitor brand queries daily — first alert signal for problems
- Document your actions and their impacts to build reliable history
❓ Frequently Asked Questions
Faut-il analyser Search Console tous les jours ou une fois par semaine suffit ?
Pourquoi mes chiffres Search Console diffèrent-ils de Google Analytics ?
Comment contourner la limite des 1000 lignes dans les tableaux ?
Les données Search Console sont-elles vraiment fiables pour piloter une stratégie SEO ?
Quelle différence entre filtrer et comparer dans Search Console ?
🎥 From the same video 1
Other SEO insights extracted from this same Google Search Central video · published on 17/03/2026
🎥 Watch the full video on YouTube →
💬 Comments (0)
Be the first to comment.