Official statement
Other statements from this video 1 ▾
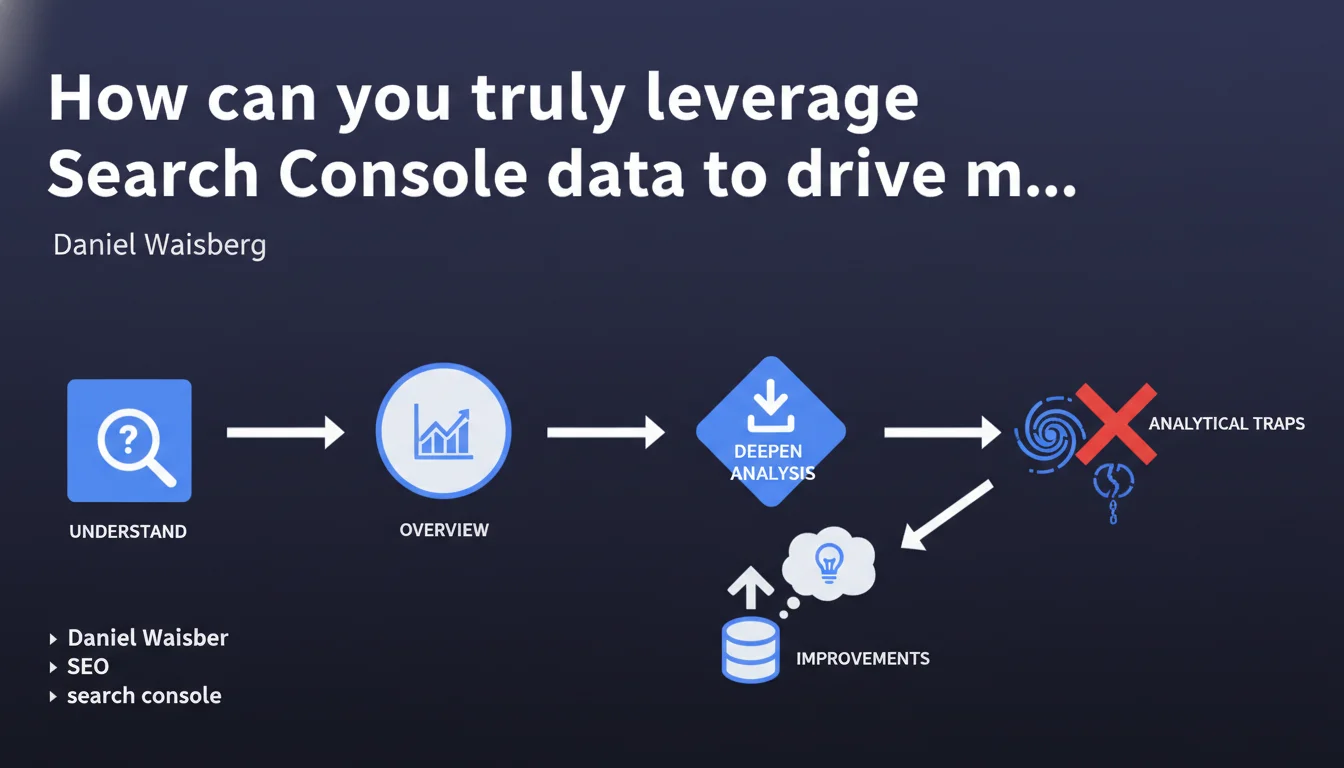
Google reminds us through Daniel Waisberg that analyzing Search Console data requires a three-step methodology: first understand what you're observing, then identify trends through the graph visualization, and finally deepen your analysis. This methodical approach aims to prevent misinterpretations and hasty decisions based on poorly understood data.
What you need to understand
Why does Google insist on a rigorous analysis methodology?
The Search Console is overflowing with raw data that many of us check daily. But here's the trap: data taken out of context can lead to completely false conclusions.
Google reminds us of something obvious that we too often forget in the rush: before drawing conclusions, you must first understand what each metric actually represents. A click isn't always just a click — depending on the search type, the featured snippet displayed, or the position of the result.
What is this three-step methodology?
The proposed approach follows a logic of progressive zooming in. First step: make sure you understand the metrics displayed (impressions, clicks, CTR, position). Second step: observe the graph to spot macro trends — spikes, drops, seasonality.
Third step only: dig into data segments, compare periods, filter by queries or pages. This approach prevents diving directly into details without establishing your interpretive framework.
What are the common mistakes to avoid?
The main error? Confusing correlation with causation. A traffic spike coincides with a technical update: was that the cause or just a timing coincidence? Without methodology, you attribute wins or losses to the wrong factors.
Another classic pitfall: comparing non-comparable periods (weekdays vs weekends, periods with different holidays). Or interpreting an average position change without looking at the actual distribution of impressions by position.
- Understand first what metrics are actually measuring before analyzing them
- Observe general trends via graphs before diving into details
- Deepen analysis only after with relevant segments and comparisons
- Always contextualize variations: seasonality, external events, technical changes
SEO Expert opinion
Does this statement really bring anything new to the table?
Let's be honest: this "methodology" amounts to basic analytical common sense. Any professional working with data should naturally follow this logic. This reminder mainly reveals the reality on the ground — many people use Search Console without analytical training.
The problem is that Google stays at the level of principle without providing concrete examples. Which metrics are most often misinterpreted? What use cases does this method actually change the conclusion for? [To verify]: this statement critically lacks practical examples to be truly useful.
In what contexts does this approach show its limitations?
This method works well for exploratory or diagnostic analysis. But it becomes insufficient for continuous monitoring or predictive analysis.
On sites with thousands of pages and hundreds of thousands of queries, overall graph visualization often masks important signals. A sudden drop on a long-tail segment can be drowned out in the mass of other metrics. In these cases, you need more advanced statistical analysis tools, automated alerts, and initial segmentation before even looking at graphs.
What nuances should be added to this recommendation?
Search Console has structural biases that no analysis methodology can overcome. Data is sampled above a certain volume, impressions are counted differently depending on SERP features, and some queries remain hidden for privacy reasons.
Furthermore, average position is a notoriously misleading metric — it can improve while traffic drops, simply because high-volume queries moved slightly up while long-tail traffic collapsed. A rigorous methodology must integrate these known limitations.
Practical impact and recommendations
Concretely, how do you apply this method to your site?
Start by documenting what each metric means in your specific context. A click on an e-commerce page doesn't have the same value as a click on a blog post. Note your site's particularities: active rich snippets, featured snippets you target, knowledge panels.
Next, define your relevant reference periods. For a B2B site, month-to-month comparisons might mask seasonality; for a news site, day-to-day comparison might be too volatile. Adapt your temporal granularity to your business.
Finally, create custom segments according to your business priorities: product pages vs informational content, branded vs generic queries, mobile vs desktop. These segments become your recurring analysis filters.
What interpretation errors must you absolutely avoid?
Never interpret an isolated variation without looking at the full picture. A CTR drop may be offset by an impressions increase resulting in more clicks overall. Always view metrics in correlation.
Avoid overreacting to short-term fluctuations. A variation over 2-3 days might be statistical noise. Wait at least a full week before concluding a real trend — unless there's an obvious sudden drop requiring immediate investigation.
Beware of automatic comparisons offered by the interface. "Compare last 28 days with previous period" might compare December with November, two structurally different months. Choose your comparison periods manually.
How do you structure an efficient analysis routine?
Establish a weekly ritual: every Monday morning, overview of the past week vs same week last year. Note significant variations (±20% minimum) and investigate potential causes.
Monthly, do a deeper audit: which pages progressed or regressed, what new terms appear, what historical queries are disappearing. Cross-reference with your SEO actions that month to validate or invalidate your hypotheses.
This analysis requires time and advanced analytical expertise to avoid false conclusions. If your team lacks resources or advanced analytical skills, support from a specialized SEO agency can prove valuable for implementing these processes and correctly interpreting weak signals before they become major issues.
- Precisely document what each metric represents in your context
- Define comparison periods coherent with your seasonality
- Create custom segments according to your business priorities
- Implement a weekly and monthly analysis routine
- Always cross-reference Search Console with Analytics and server logs
- Never react to an isolated variation of less than one week
- Keep a record of SEO actions to correlate with data changes
❓ Frequently Asked Questions
Faut-il analyser les données Search Console tous les jours ?
Quelle est la période de comparaison idéale dans Search Console ?
Pourquoi la position moyenne est-elle une métrique trompeuse ?
Les données Search Console sont-elles fiables à 100% ?
Peut-on se baser uniquement sur Search Console pour piloter son SEO ?
🎥 From the same video 1
Other SEO insights extracted from this same Google Search Central video · published on 17/03/2026
🎥 Watch the full video on YouTube →
💬 Comments (0)
Be the first to comment.