Official statement
Other statements from this video 8 ▾
- □ Google indexe-t-il vraiment le HTML rendu plutôt que le code source ?
- □ Comment l'outil d'inspection d'URL révèle-t-il la source de découverte de vos pages ?
- □ Google respecte-t-il vraiment votre balise canonical ou décide-t-il seul ?
- □ Comment vérifier efficacement les directives X-Robots dans vos en-têtes HTTP ?
- □ Les ressources JavaScript bloquées par robots.txt sabotent-elles vraiment votre indexation ?
- □ Faut-il vraiment s'inquiéter des erreurs de ressources dans la Search Console ?
- □ Pourquoi le test d'URL en direct de Google Search Console donne-t-il des résultats différents à chaque fois ?
- □ Faut-il vraiment ignorer les captures d'écran dans les outils de test de Google ?
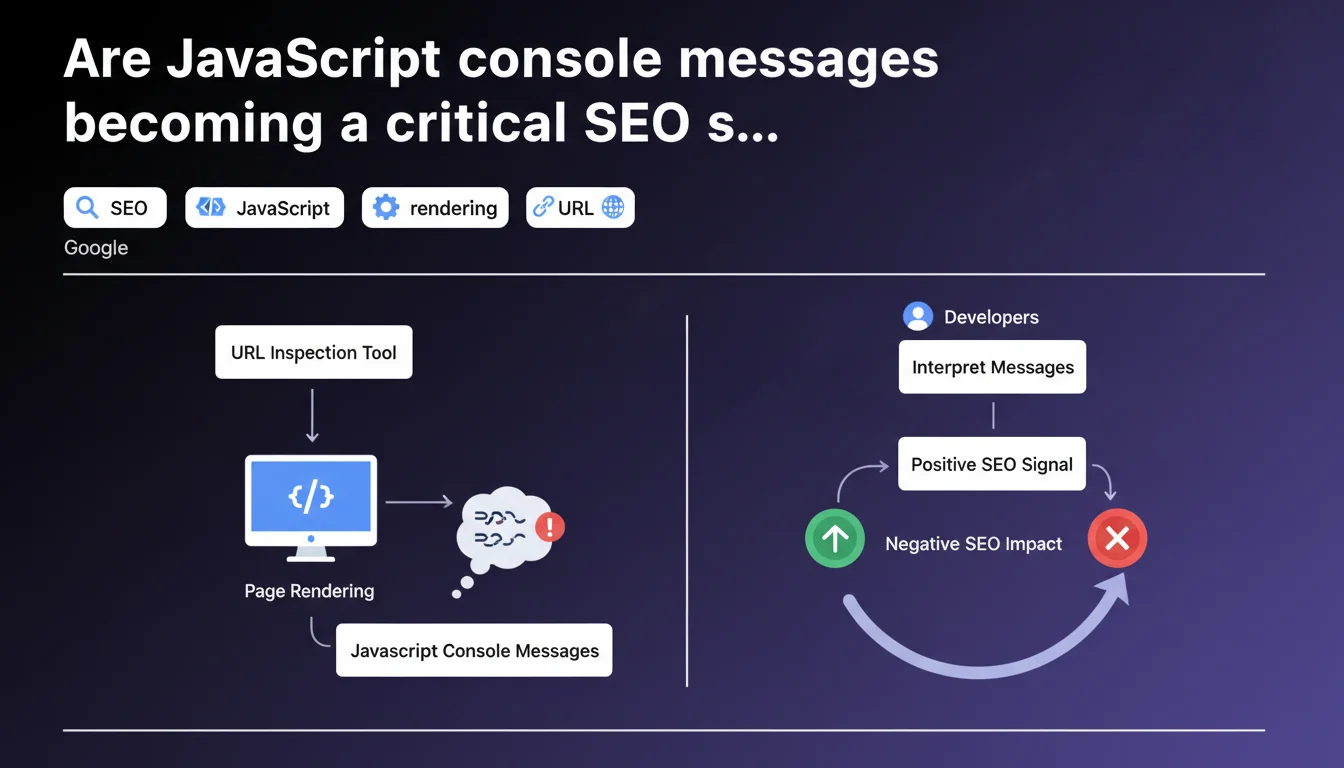
Google's URL inspection tool now displays JavaScript console messages generated during rendering. These messages can reveal errors or anomalies impacting Googlebot's server-side rendering. A developer capable of interpreting them has valuable clues for diagnosing why certain pages aren't indexing correctly.
What you need to understand
Why is Google exposing console messages in its inspection tool?
Google has been rendering pages through a full Chrome engine for some time now. This means JavaScript executes, errors appear, and every console message — warning, error, log — is captured during this process.
The URL inspection tool now displays these messages. Concretely? If your SPA loads a critical component via JS and it silently crashes, you'll see it in Googlebot's console. It's direct access to what the bot actually sees during rendering.
What does this change for diagnosing indexing issues?
Before, we inferred. We tested locally, checked in Chrome, hoped Googlebot saw the same thing. Now, we know — or at least, we have an official record of what happens on Google's side.
Console messages reveal resource loading errors, scripts blocked by CSP, timeouts, APIs that fail. All these clues can explain why content generated in JS doesn't appear in the indexed HTML snapshot.
Do these messages have a direct impact on rankings?
The announcement says nothing about that — and it's probably intentional. Google talks about diagnostics, not penalties. JS errors aren't an explicit ranking factor, but if they prevent content from displaying, they impact indexability and therefore visibility in the long run.
Let's be honest: a page generating 50 console errors but displaying all content correctly won't be penalized. However, if these errors block the rendering of key elements, you have a problem.
- Console messages are visible in the URL inspection tool in Search Console
- They reveal errors, warnings and logs captured during rendering by Googlebot
- They help diagnose why JS-generated content isn't indexing
- They aren't a direct ranking signal, but can hide indexability issues
- Developers must interpret these messages in the context of their specific application
SEO Expert opinion
Is this transparency really new?
Not really. Google has been testing JS rendering for years, and tools like Screaming Frog or OnCrawl already allowed capturing console errors during crawls with headless Chrome. The novelty is that Google officially endorses this data and makes it available directly in Search Console.
That said, be careful — the messages displayed are those captured at the time of testing in the inspection tool. They don't necessarily reflect what happened during the last real crawl. If your script crashes intermittently, you might see nothing during a manual test.
What are the practical limitations of this tool?
The main issue: interpretation. Google explicitly says developers must interpret these messages "for their specific application." In other words, Google won't tell you if an error is blocking or benign. That's up to you to figure out.
Some errors are cosmetic. Others break everything. A message like "Failed to load resource: net::ERR_BLOCKED_BY_CLIENT" could mean an adblocker blocked an analytics script — with no SEO impact — or a critical dependency failed to load — major impact. [Verify this] systematically by cross-referencing with the rendered HTML snapshot.
Do console messages faithfully reflect daily crawling?
Not always. The inspection tool simulates real-time rendering, but conditions can differ from actual crawling: network delays, CDN cache, third-party API availability. A page might display correctly during testing and crash during regular crawling if an external dependency is down.
Furthermore, Google uses a rendering budget. If your page takes 15 seconds to load all its JS, some elements might never appear in the indexed snapshot — and associated console errors won't be captured either.
Practical impact and recommendations
How can you efficiently audit console messages for SEO?
First reflex: systematically test strategic pages in the URL inspection tool. Look at the JavaScript console displayed and note each error or warning. Prioritize critical errors — those blocking the loading of scripts or resources essential to content.
Next, reproduce Googlebot conditions locally. Use Chrome DevTools with a Googlebot user-agent, disable cache, simulate a slow connection. Compare the errors observed with those reported by Google. If they differ, dig deeper — this can reveal server configuration or timeout issues.
Which errors deserve immediate action?
Anything blocking main content rendering. Errors like SyntaxError in critical scripts, 404 on essential JS bundles, CORS preventing dynamic data loading. These errors must be fixed first.
Warnings about deprecated features or non-critical third-party APIs (analytics, chat, ads) can wait. Focus your efforts on what directly impacts displaying text, titles, internal links — everything Google needs to see to index correctly.
What should you implement for continuous monitoring?
Set up regular crawling with a tool capable of capturing console errors (Screaming Frog in JavaScript mode, OnCrawl, or a custom Puppeteer script). Configure alerts to be notified as soon as a new critical error appears on strategic pages.
On the development side, integrate automated tests validating JS rendering before each deployment. A CI/CD pipeline that fails if critical console errors are detected prevents many production surprises.
- Test key pages in the URL inspection tool and analyze displayed console messages
- Identify and fix in priority the errors blocking main content rendering
- Reproduce Googlebot conditions locally to cross-reference observations
- Set up regular crawling capturing console errors for continuous monitoring
- Integrate automated JS rendering tests into the deployment pipeline
- Train dev teams to interpret errors in an SEO context
- Document accepted benign errors to avoid reprocessing them in each audit
❓ Frequently Asked Questions
Les erreurs console JavaScript pénalisent-elles directement le classement d'une page ?
Tous les messages console sont-ils visibles dans l'outil d'inspection d'URL ?
Comment savoir si une erreur console est critique pour le SEO ?
Faut-il corriger toutes les erreurs console pour optimiser le SEO ?
Peut-on automatiser la détection de ces erreurs console ?
🎥 From the same video 8
Other SEO insights extracted from this same Google Search Central video · published on 02/08/2023
🎥 Watch the full video on YouTube →
💬 Comments (0)
Be the first to comment.