Official statement
Other statements from this video 7 ▾
- □ Faut-il encore utiliser rel=next et rel=prev pour la pagination ?
- □ Faut-il vraiment valider son HTML W3C pour être crawlé par Google ?
- □ Google rend-il vraiment l'intégralité de vos pages JavaScript ?
- □ Le HTML sémantique renforce-t-il vraiment la confiance de Google dans votre contenu ?
- □ Google lit-il vraiment vos retours sur sa documentation SEO ?
- □ Peut-on vraiment faire confiance à la documentation officielle de Google ?
- □ Lighthouse calcule-t-il vraiment ses scores de manière transparente ?
PageSpeed Insights and Lighthouse scores naturally fluctuate from one measurement to another. Google confirms that network conditions at the time of testing directly influence the results. The internal weighting of metrics also evolves regularly, making comparisons over time tricky.
What you need to understand
Why do PageSpeed scores vary between two consecutive tests?
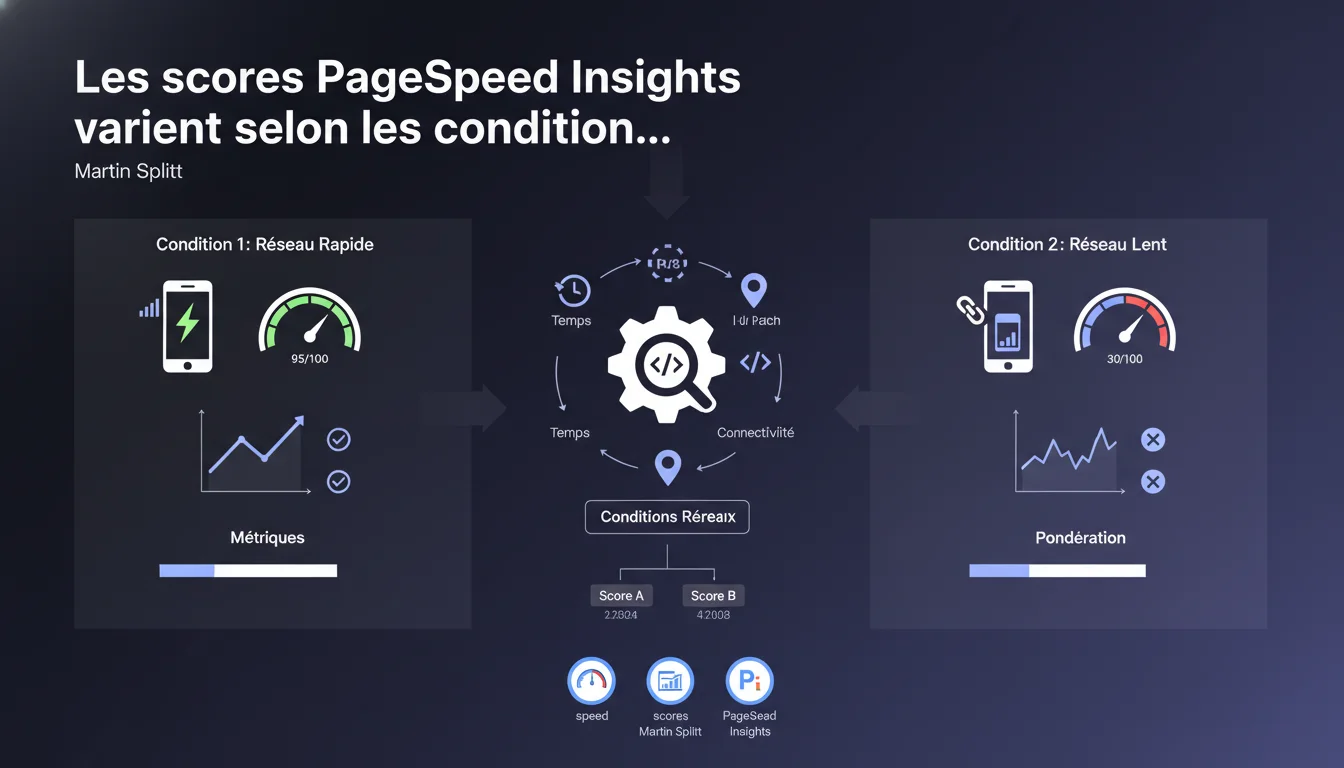
Martin Splitt explains that network conditions at the time of measurement directly impact the results. Specifically, your internet connection, server latency, and the load on the CDN — all these factors create variations between two audits.
PageSpeed Insights and Lighthouse do not measure an absolute value set in stone. They capture a snapshot performance in a given context. The same site can fluctuate by 5 to 15 points depending on the time of the test.
How does the weighting of metrics evolve?
Google regularly adjusts the relative weight of each Core Web Vitals metric. What counted for 30% of the score six months ago may weigh 25% today.
This evolution follows Google's priorities on user experience. FID has recently been replaced by INP — evidence that the reference point is constantly shifting.
- Scores naturally fluctuate between tests due to variable network conditions
- The internal weighting of metrics (LCP, CLS, INP) evolves over time
- It's impossible to directly compare a score from today with a score from last year
- Variations of ±5 points don't necessarily reflect a real degradation
- Focus on the overall trend rather than a single number
SEO Expert opinion
Does this statement really explain the observed discrepancies?
Let's be honest: Google remains vague on the acceptable range of variation. Splitt confirms the phenomenon without providing a precise range. [To be verified]
In practice, discrepancies can reach up to 20 points for the same page tested 10 minutes apart. Network conditions do not explain everything — server load, caching, and ongoing A/B tests also play a role.
Should you really trust PageSpeed Insights for diagnostics?
PageSpeed Insights remains a diagnostic tool, not an absolute truth. Data from the Chrome UX report (CrUX) — based on real users — is much more reliable for assessing on-the-ground performance.
The problem? Many clients judge solely based on the green/orange/red score, without understanding that this number fluctuates. That's where the issue lies: you need to educate on the difference between lab data (snapshot score) and field data (real experience).
What are the implications for client reporting?
This statement legitimizes the variations you observe in your reports. A client who sees their score drop from 92 to 87 without a technical change now has a formal explanation.
However, communication becomes complex. You must explain that the drop is not necessarily your fault — and that the increase isn’t always deserved. Prefer charting the progress over 30 days rather than a snapshot.
Practical impact and recommendations
What should you do to manage these variations?
Stop testing just once. Conduct 3 to 5 consecutive audits and calculate the median. This approach smooths out network anomalies and provides a more accurate picture.
Prioritize CrUX data (Chrome User Experience Report) available in PageSpeed Insights. They reflect your visitors' real experiences over the past 28 days — not a one-time instance.
What mistakes should be avoided when interpreting scores?
Never compare a score from today with a score from several months ago — the weighting has changed in the meantime. Google does not publicly document these adjustments, so navigate at your own risk. [To be verified]
Don’t focus solely on the overall number. Drill down to the level of individual metrics (LCP, CLS, INP). That’s where you identify the real issues.
- Perform 3 to 5 consecutive tests and calculate the median score
- Compare CrUX data (field data) rather than lab scores
- Track progress over 30 days minimum to identify a trend
- Analyze each metric separately (LCP, CLS, INP) instead of the overall score
- Document testing conditions (time, location, network) in your reports
- Inform clients that variations of ±10 points are normal and expected
- Use third-party tools (WebPageTest, Lighthouse CI) to cross-reference sources
How can you integrate this reality into your SEO processes?
Integrate PageSpeed Insights into a broader analysis workflow. Scores are just one indicator among others — not the alpha and omega of performance.
Automate audits with Lighthouse CI or similar tools. You gain comparable historical data under identical technical conditions. And that’s where you detect real regressions.
❓ Frequently Asked Questions
Un score PageSpeed de 85 un jour et 78 le lendemain signifie-t-il une régression ?
Pourquoi Google ne donne-t-il pas de fourchette acceptable de variation ?
Les données CrUX sont-elles plus fiables que les scores PageSpeed Insights ?
Puis-je comparer un score d'il y a six mois avec celui d'aujourd'hui ?
Faut-il viser un score de 100 sur PageSpeed Insights ?
🎥 From the same video 7
Other SEO insights extracted from this same Google Search Central video · published on 13/01/2022
🎥 Watch the full video on YouTube →
💬 Comments (0)
Be the first to comment.