Official statement
What you need to understand
Why Does Google Prefer Images for Charts?
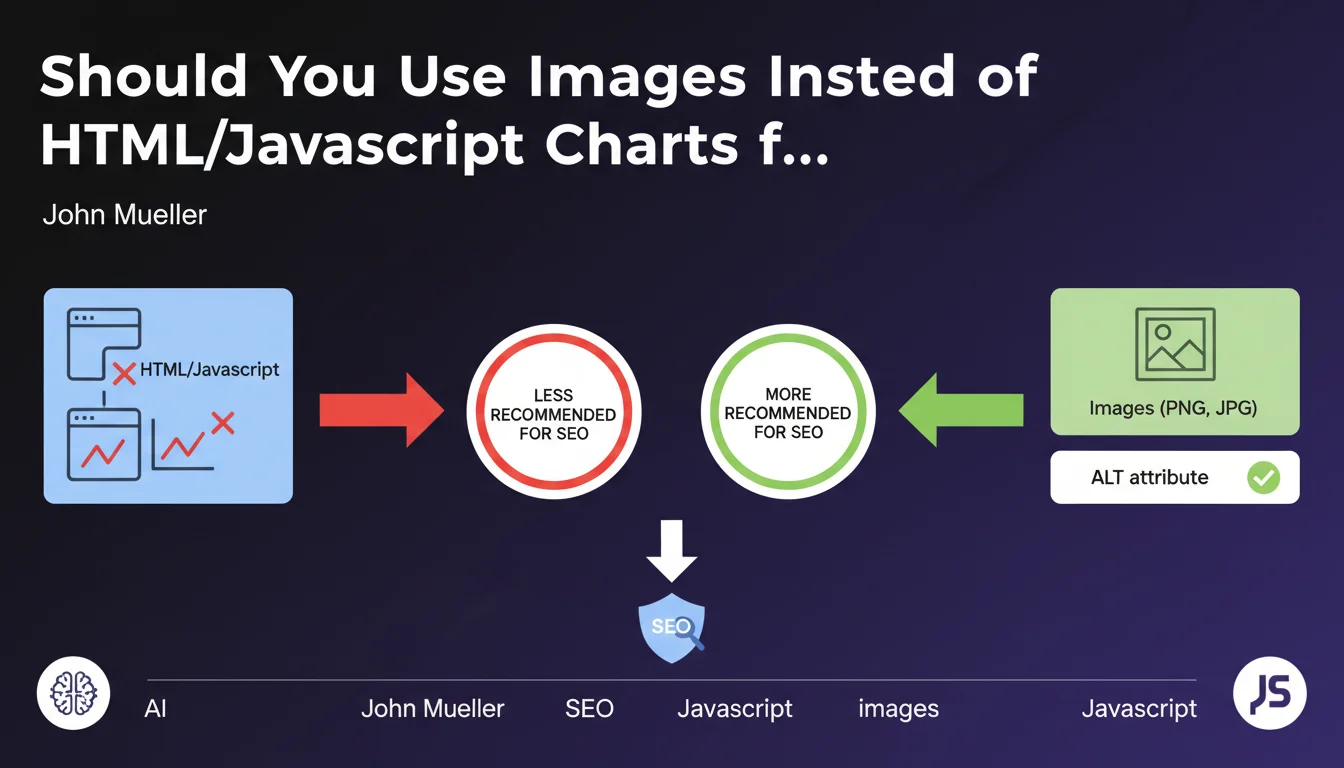
Google recommends using classic images (PNG, JPG) rather than charts generated in HTML or JavaScript. This preference is explained by Google's ability to more easily analyze visual content through image recognition algorithms.
HTML or JavaScript charts present several limitations: they are more difficult to index, their content is not always accessible to the search engine, and they don't benefit from visibility in Google Images.
What Is the Crucial Role of the ALT Attribute?
The ALT attribute plays a determining role in this recommendation. It provides a textual description of the chart, essential for Google's semantic analysis.
A well-written ALT enriches the page context and improves thematic relevance. It also serves accessibility for visually impaired users and situations where the image doesn't load.
What Are the Concrete Advantages of This Approach?
- Dual visibility: ranking in classic web results and in Google Images
- Better semantic understanding thanks to the descriptive ALT attribute
- Optimized processing time for indexing robots
- Improved accessibility for all users
- Universal compatibility with all browsers and devices
SEO Expert opinion
Is This Statement Consistent with Practices Observed in the Field?
After 15 years of observation, I confirm that sites using optimized images for their charts do indeed achieve better performance in Google Images. However, the reality is more nuanced than it appears.
Interactive charts in JavaScript are enjoying growing success with users and can generate very positive engagement signals. Google has also made progress in its ability to render and index JavaScript, even though limitations persist.
What Important Nuances Should Be Added to This Recommendation?
Google's recommendation dates from a time when JavaScript processing was much more limited. Today, the search engine can interpret complex dynamic content, although this consumes more resources.
HTML tables structured with appropriate semantic tags (table, thead, tbody, th) can actually bring SEO value, contrary to what the comment suggests. They allow for structured understanding of data.
When Should This Rule Be Reconsidered?
For complex dashboards or analysis tools requiring interactivity, JavaScript charts remain indispensable. The challenge then becomes combining both approaches.
Sites with a large crawl budget can afford JavaScript solutions, as Google will allocate sufficient resources to process them. For more modest sites, the simplicity of images remains preferable.
Practical impact and recommendations
What Should You Do Concretely to Optimize Your Charts?
The optimal strategy consists of creating static images of your most important charts, even if you also use interactive versions. Export your charts in PNG for quality or in JPG for optimized weight.
Write descriptive and contextual ALT attributes, not simply "chart" or "table". Describe what the chart shows: "Evolution of organic traffic from January to December 2024, with 45% growth".
For complex charts, add a complete textual description below the image or in an adjacent paragraph. This reinforces semantic understanding and improves accessibility.
What Common Mistakes Should You Absolutely Avoid?
Never use generic ALT attributes like "image" or "chart". It's a missed opportunity to enrich your semantic content.
Avoid images that are too heavy and slow down loading. Compress your charts without sacrificing readability, and use modern formats like WebP when possible.
Don't systematically replace all your HTML tables with images. Simple tabular data is better kept in HTML for accessibility and the ability to copy-paste.
How Can You Check and Improve Existing Content on Your Site?
- Audit your pages containing JavaScript or Canvas charts not accompanied by alternatives
- Check that all your chart images have a descriptive ALT attribute
- Test the presence of your charts in Google Images via Search Console
- Analyze the rendering time of your pages with charts in Google Search Console (Page Experience report)
- Create static image versions of your most strategic charts
- Add structured data (schema.org) when relevant to enrich the context
- Optimize the weight of your images with appropriate compression
- Implement lazy loading for charts at the bottom of the page
💬 Comments (0)
Be the first to comment.